


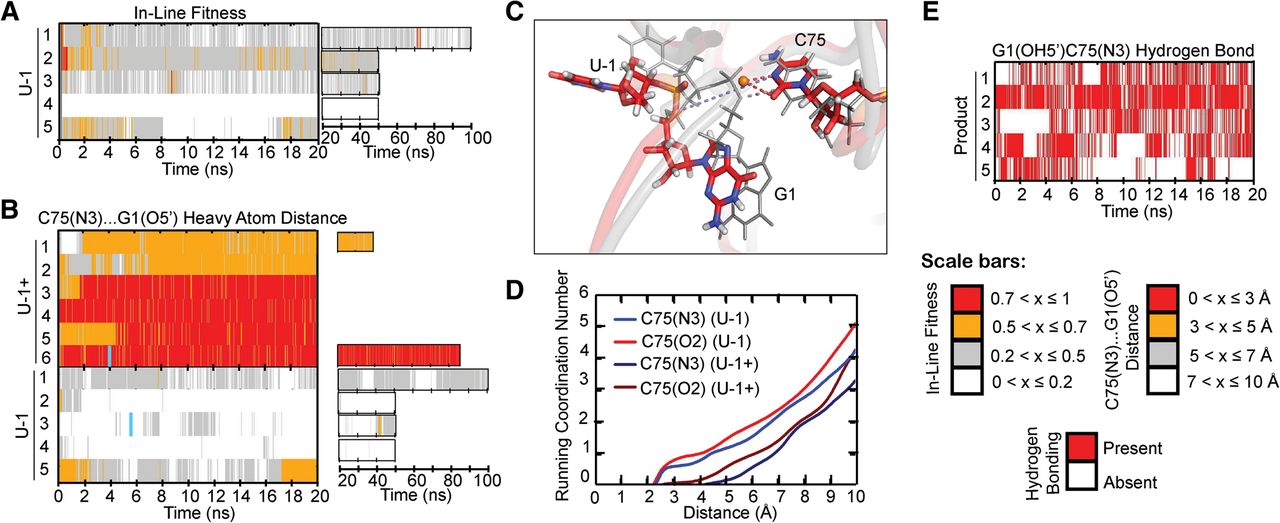
A C75(N3)…G1(O5′) hydrogen bond supports a product-like active site. (A) In-line fitness of U-1 trajectories. (B) Comparison of C75(N3)…G1(O5′) heavy atom distances in U-1+ and U-1 trajectories. (C) Structural overlay of U-1 and U-1+ active sites. The U-1 structure is in color, while the U-1+ structure is in transparent gray. Relevant residues are shown as sticks and thickened lines, respectively. Red dashed lines indicate stable coordination of the orange sodium ion. Light blue dashed lines indicate the C75H+(N3H3+)…G1(O5′) hydrogen bond lost in the U-1 structures. Colored atoms in stick representations are colored as indicated in Figure 3. The cyan lines in panel B denote from which replicate and at what times the snapshots were taken. (D) Running coordination numbers of U-1+ and U-1 ion-binding residues. The plotted curves indicate the number of sodium ions coordinated by a given residue at a range of distances and are weighted averages from all available simulations of a given set. (E) Time traces for the reverse G1(OH5′)…C75(N3) hydrogen bond in product trajectories.




