


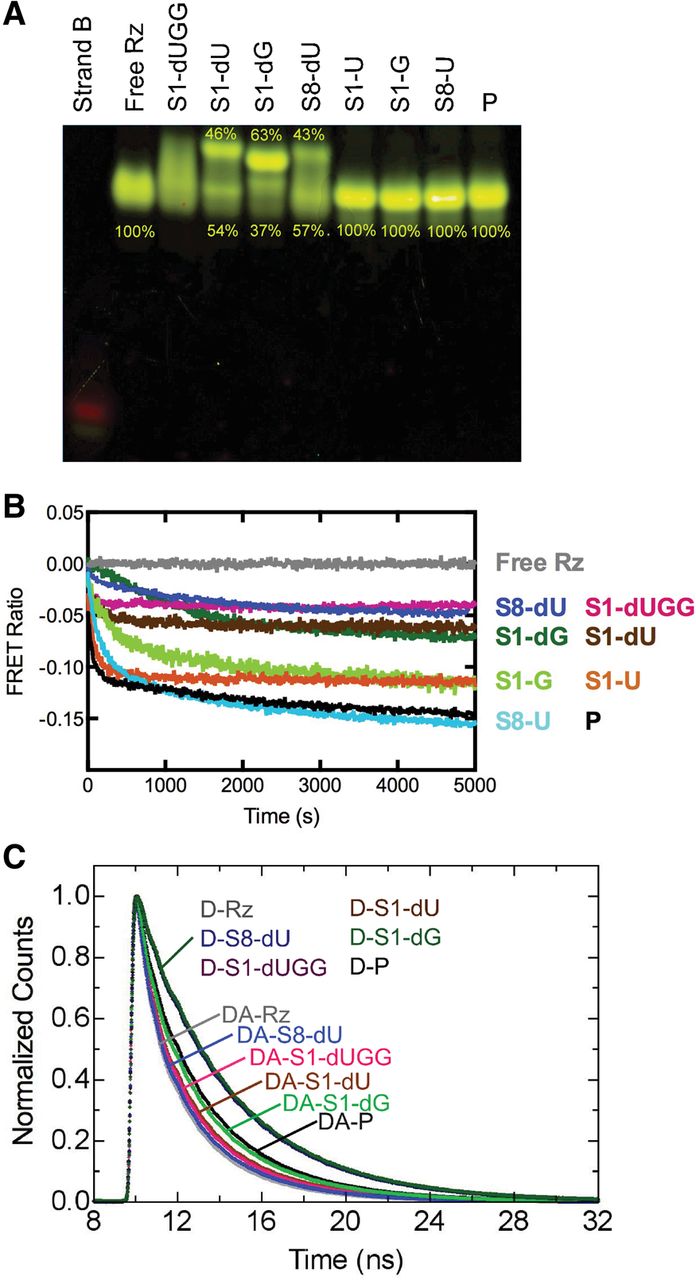
FRET probing of our eight trans-acting precursor and product ribozymes. (A) Fluorescent EMSA of the individual complexes as indicated. Where appropriate, the relative fractions in the main bands of a lane are given. Strand B and free ribozyme (Rz) lanes are shown for reference. (B) Normalized ssFRET time courses upon substrate or product addition, as indicated. A decrease in FRET ratio indicates a lengthening of the fluorophore distance along the longitudinal axis of the ribozyme. Each trace is an average of at least three trials. (C) Representative fluorescein fluorescence decays for free ribozyme (Rz), ribozyme bound to noncleavable substrates, and ribozyme bound to product (P), as indicated. Traces for ribozymes labeled with donor-only (D) and with donor plus acceptor (DA) are plotted. Each trace is one of three replicates but composed of an average of five reads.




