


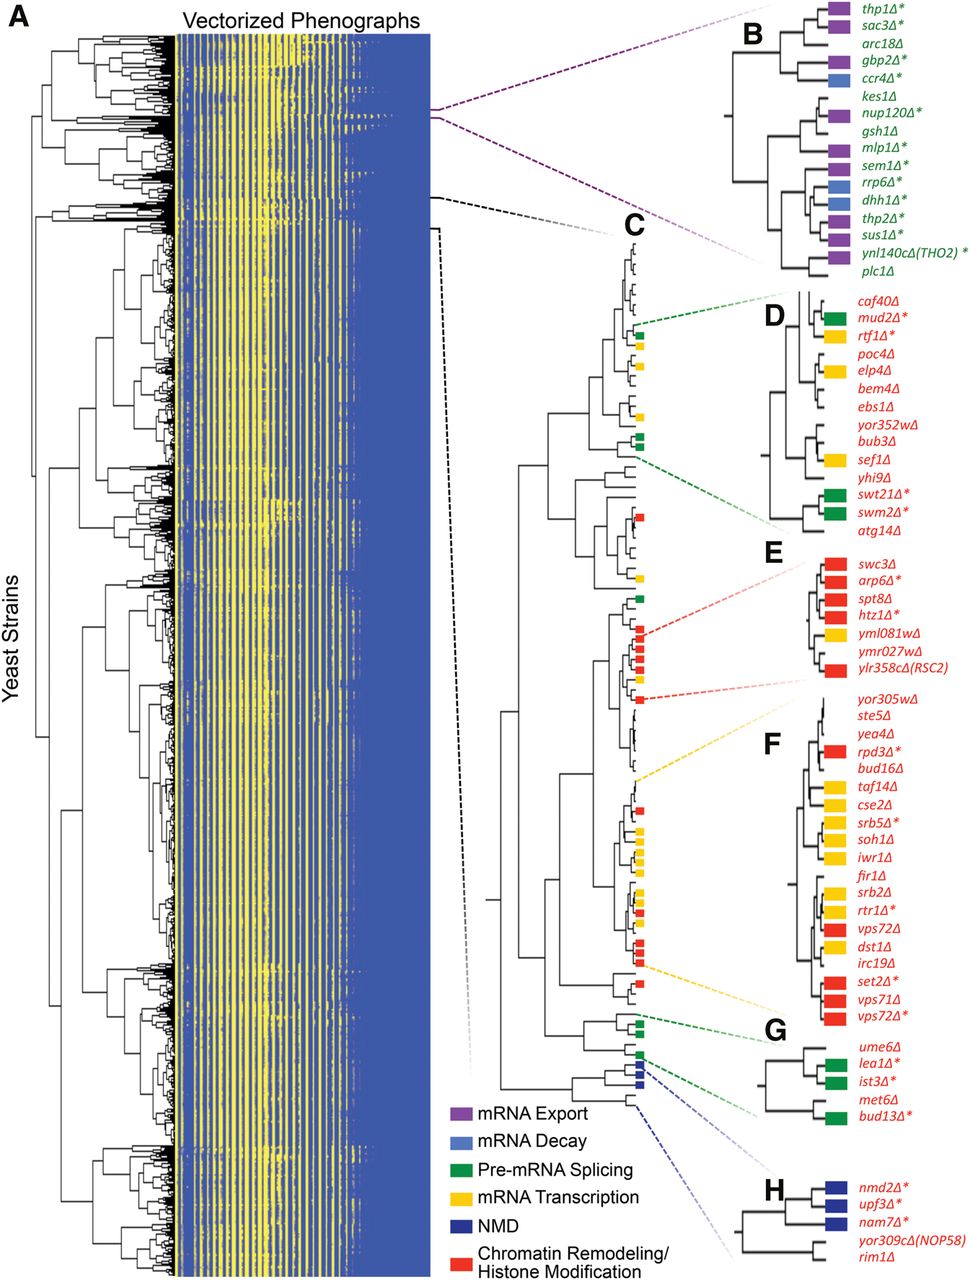
An unbiased comparison of phenographs from the deletion collection strains reveals clustering of related genes. Clustered, vectorized phenograph data for the 4967 deletion collection strains as calculated by Cluster (using complete linkage/uncentered correlation) and visualized by Java TreeView (A) (see Materials and Methods). The 1600 bins (columns) are ordered from the origin of the phenograph to the top right of the phenograph and correspond to the same bin across all strains analyzed (rows). Yellow shading indicates the level of occupancy in the given bin. A number of green-shifted deletion mutations represent mRNA export and RNA decay mutants and cluster strongly (B). The gene deleted is indicated and functional classes of genes are color coded according to the scale at the bottom. A representative phenograph for a green-shifted mutant overlaid on a grayscale wild type is shown. Asterisks indicate strains with phenographs in Figure 4. Genes in parentheses are partially overlapped by the deleted dubious or unverified ORF. A midlevel view (C) of the clustering behavior of a large red-shifted clade containing a number of pre-mRNA splicing mutants in shown. Clusters of specific red-shifted gene expression deletion mutants (D–H) are shown. Branch lengths are kept to scale in elements to demonstrate levels of similarity within and between clades. For reference, asterisks indicate strains with phenographs in Figures 3 and 4.




