


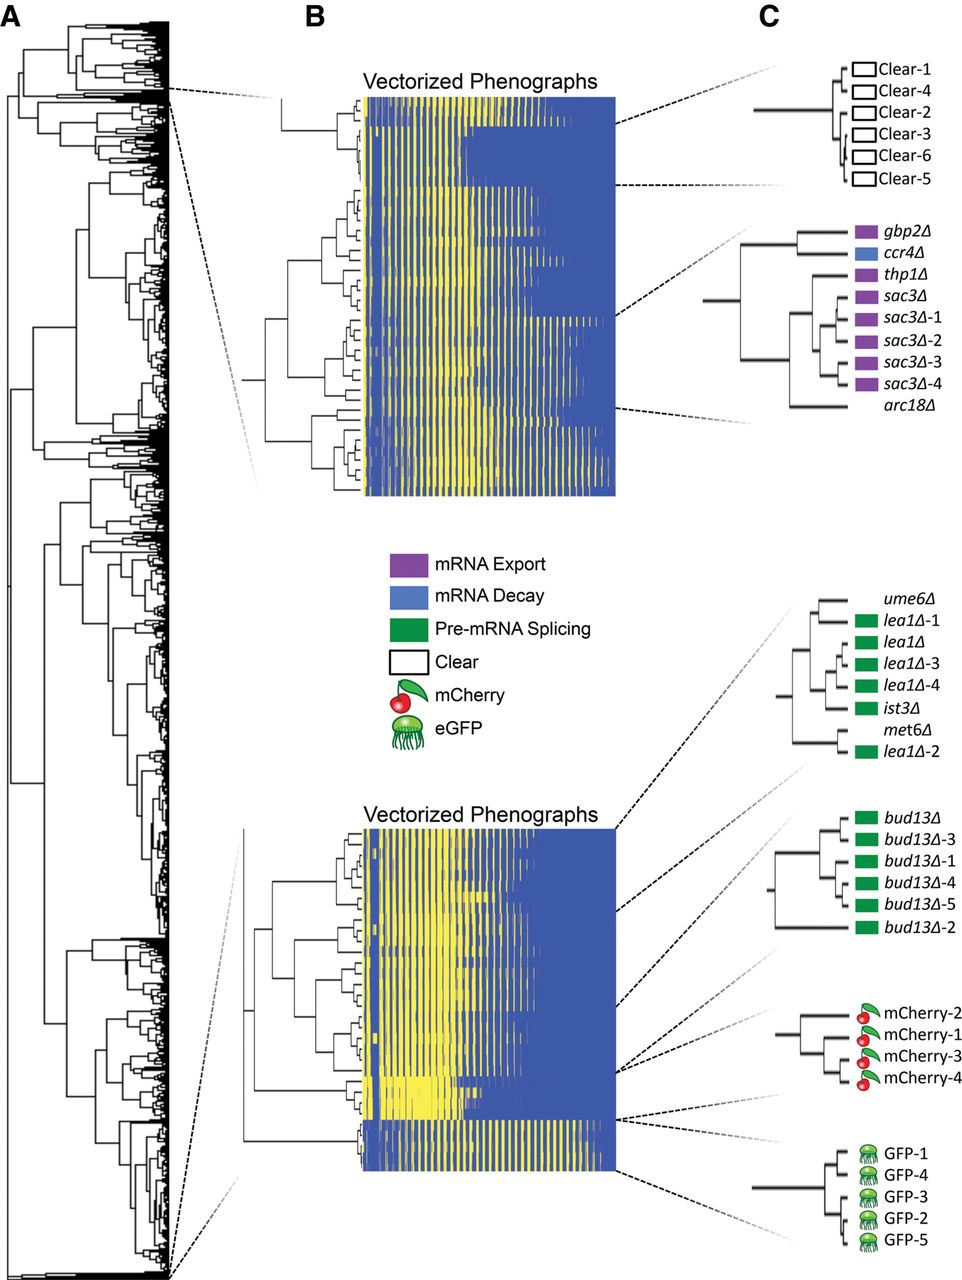
Quantifying the robustness and reproducibility of the reporter assay. Phenograph data for fluorescent controls and replicates of telltale deletion mutants were incorporated into the deletion collection data set and clustered (A). The control data were taken from random days of large-scale analysis and serve as day-to-day controls to monitor experimental reproducibility. Phenograph data for the deletion mutants and control samples were binned and clustered using complete linkage and an uncentered correlation similarity metric and the complete dendrogram is shown. Clusters of interest were enlarged and the binning pattern for several mutants are shown (B). The bottom panel (mCherry and GFP) clearly demonstrates the relationship between phenograph and binning pattern. Bins are ordered from the origin to the top right, increasing in y value till the top, then shifting to the next x bin, etc. Dash numbers represent biological duplicates of controls sampled on different days and are shown in the enlargements (C). Nodes without a dash are the yeast strains that were analyzed within the original screen. Nodes are color coded by function or sample indicated in the legend.




