


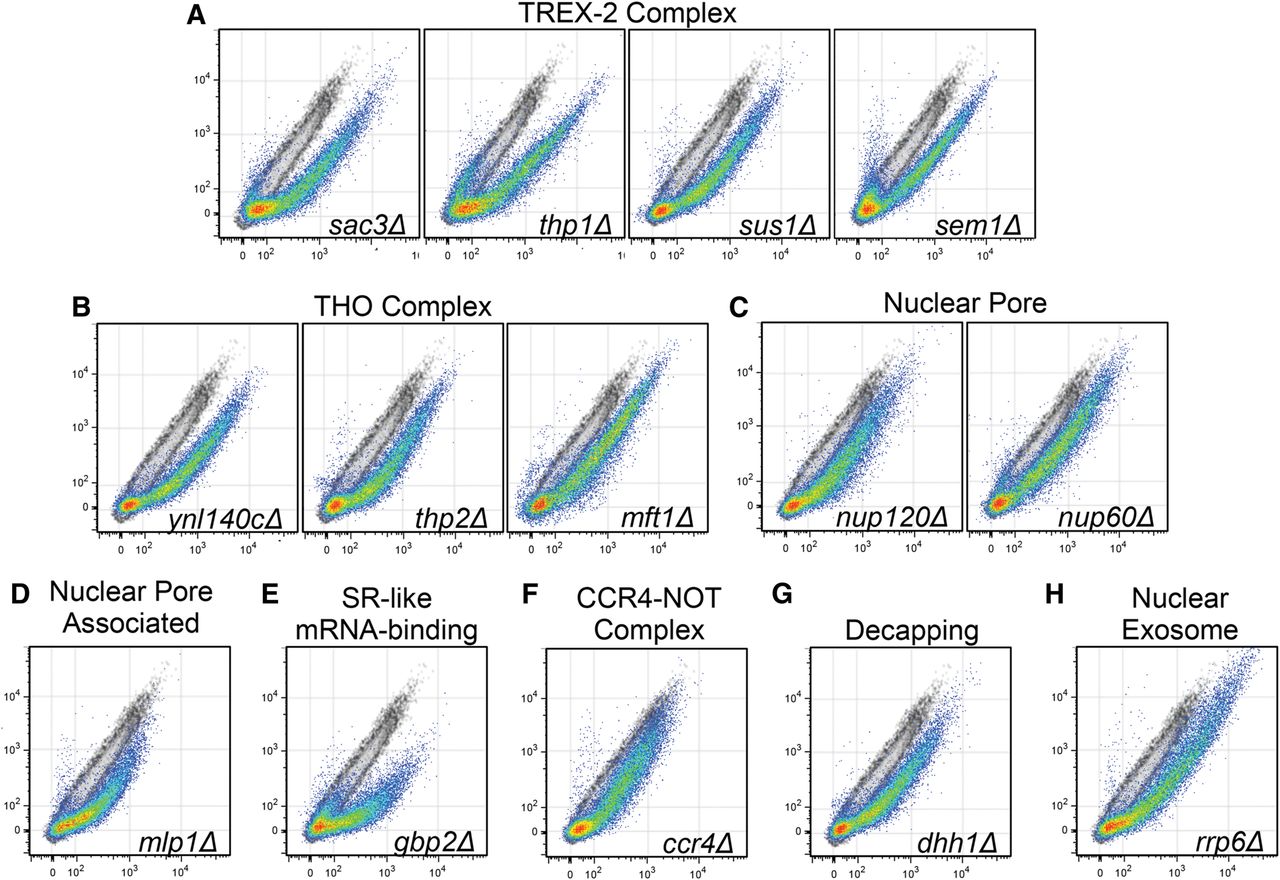
FIGURE 4.
Mutations within specific gene expression pathways result in green-shifted phenographs. The gene expression reporter described in Figure 1A was transformed into the indicated deletion strains. Each phenograph overlay contains data from the indicated deletion strain in pseudo color and an isogenic wild-type strain (BY4742) in the grayscale for comparison. Each gene expression process or complex (A–H) is indicated above the phenograph. The gene YNL140C overlaps the verified ORF THO2. The y- and x-axis depict mCherry and GFP fluorescence, respectively.




