


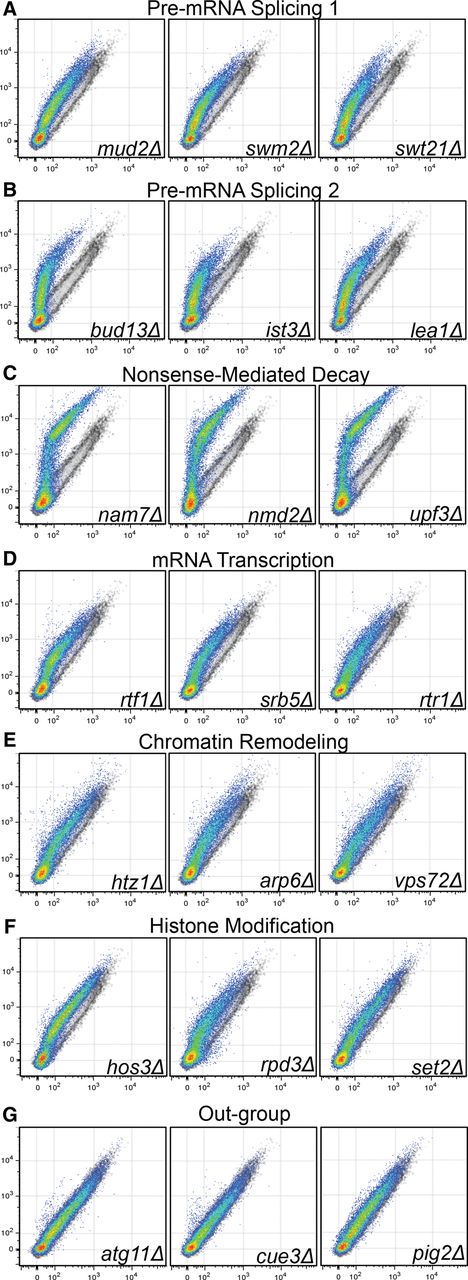
FIGURE 3.
Mutations within specific gene expression pathways result in red-shifted phenographs. The gene expression reporter described in Figure 1, A and C, was transformed into the indicated strains. Each phenograph overlay contains data from the indicated deletion strain in pseudo color and an isogenic wild-type strain (BY4742) in the grayscale for comparison. Each gene expression process (A–F) is indicated above the phenographs and the out-group (G) represents three unrelated, randomly chosen deletion mutants to serve as negative controls. The y- and x-axis depict mCherry and GFP fluorescence, respectively.




