


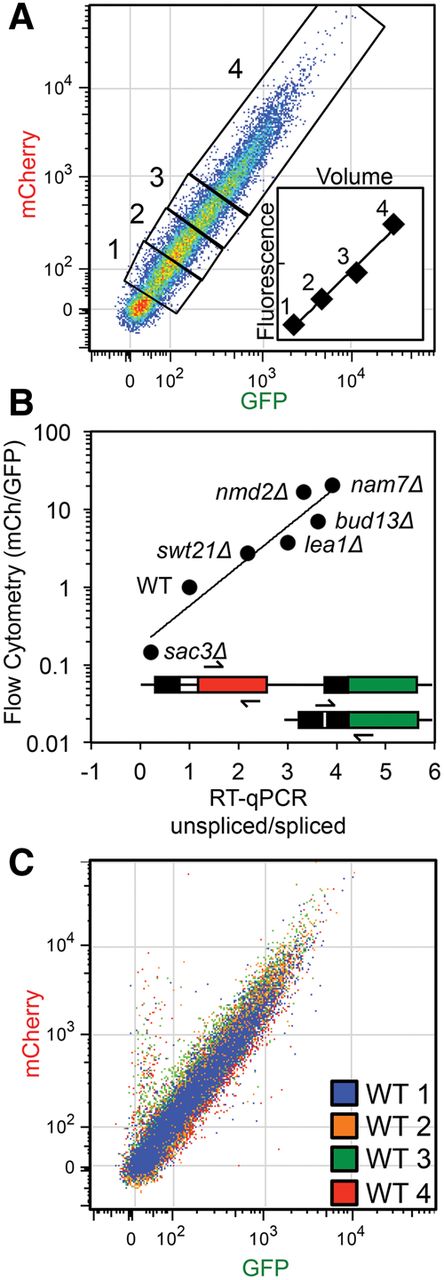
The reporter phenograph is a reproducible product of cell volume and reporter transcript levels. Reporter expressing cells were gated (A) into four equally populated groups based on their position within the phenograph, moving out from origin (essentially grouping cells based on their fluorescence intensity). The inset compares the average total fluorescence with the average cell volume (forward scatter) for the four groups. An exponential regression line is applied (R2 = 0.98). The flow cytometry mCherry/GFP ratio is plotted for several deletion strains vs. the ratio of unspliced and spliced reporter transcripts (B), which was determined by RT-qPCR analysis. Flow cytometry and RT-qPCR ratios are relative to wild type (WT) and an exponential trend line is shown (R2 = 0.91). The inset cartoon depicts the primer location for the unspliced (top) and spliced transcripts. Phenographs from wild-type yeast analyzed on different days (C) are visually indistinguishable when overlaid.




