


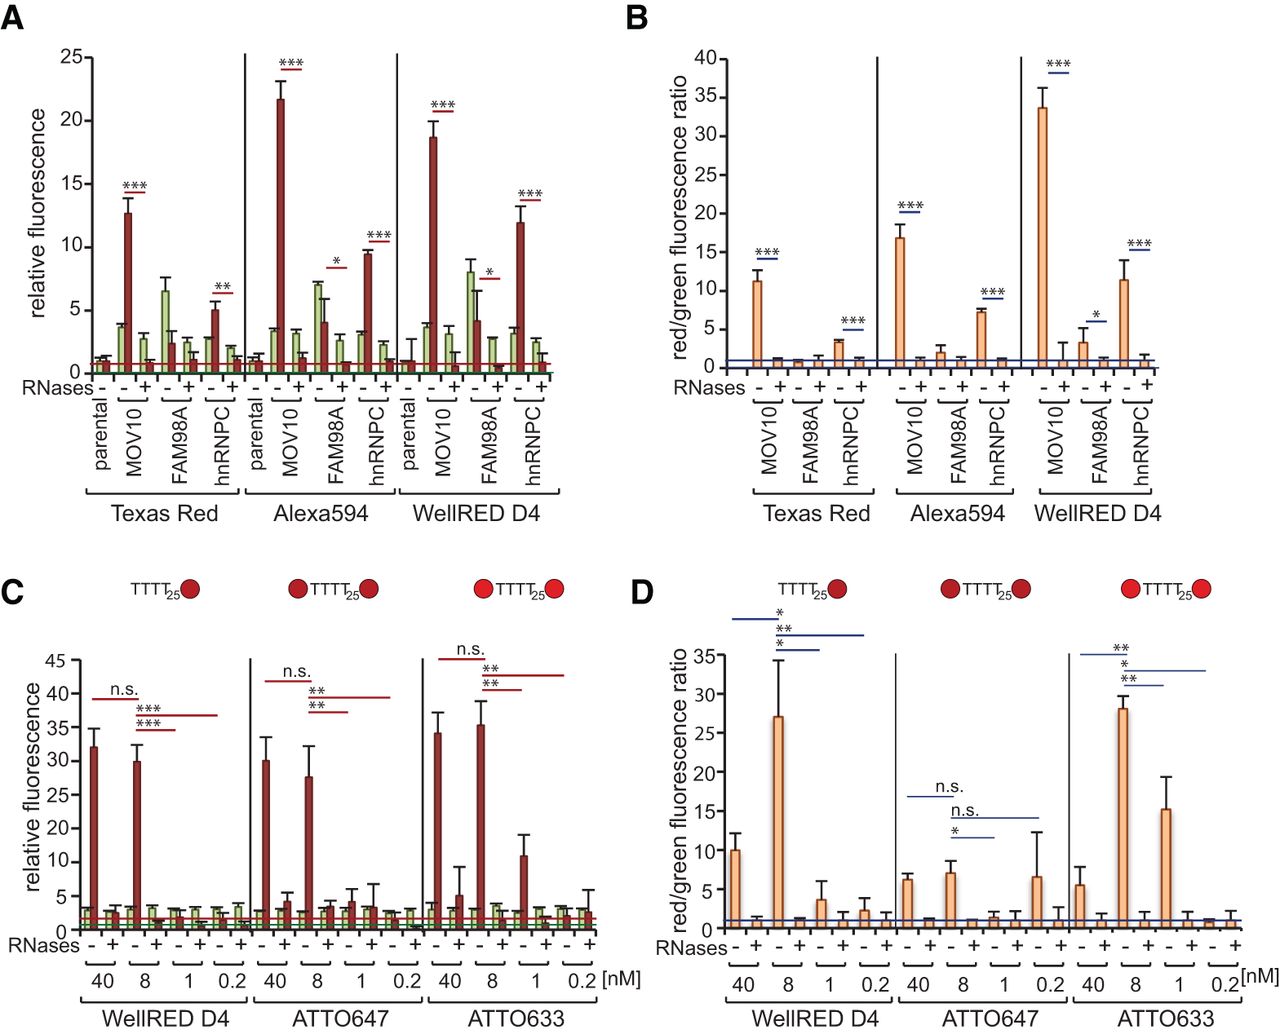
Evaluation of different fluorophores and probes in the dual fluorescence RNA-binding assay using GFP-multiTrap. (A,B) Parental, MOV10–YFP, hnRNPC–eGFP, and FAM98A–eGFP cell lines were employed for the dual fluorescence RNA-binding assay using oligo(DT)25 probes coupled with Tred, Alexa Fluor594, or WellRED D4. After 254-nm UV irradiation and cell lysis, control samples were RNase-treated prior to immunoprecipitation in GFP-multiTrap. The graphs represent relative green (eGFP/YFP) and red (Tred/Alexa Fluor594/WellRED D4) fluorescence levels (A) and their ratios normalized to RNase-treated samples (B). The graphs were generated from two biological and three technical replicates (total of six immunoprecipitations). (C,D) MOV10–YFP was induced for 16 h and cells were irradiated with 254-nm UV light. Control samples were RNase-treated and fluorescent fusion proteins were immunoprecipitated with GFP-multiTrap. Co-immunoprecipitated RNAs were hybridized with 40, 8, 1 or 0.2 nM oligo(DT) probe coupled with either one WellRED D4 molecule or two ATTO 647 or ATTO633 molecules. The graphs represent relative green (YFP) and far red (WellRED D4/ATTO 647/ATTO633) fluorescence levels (C) and their ratios normalized to RNase-treated samples (D). The graphs were generated from three technical replicates (total of three immunoprecipitations). (*) P < 0.05; (**) P < 0.01; (***) P < 0.001. Horizontal red and green lines represent averaged background signal for red and green signal, respectively, extracted from control samples.




