


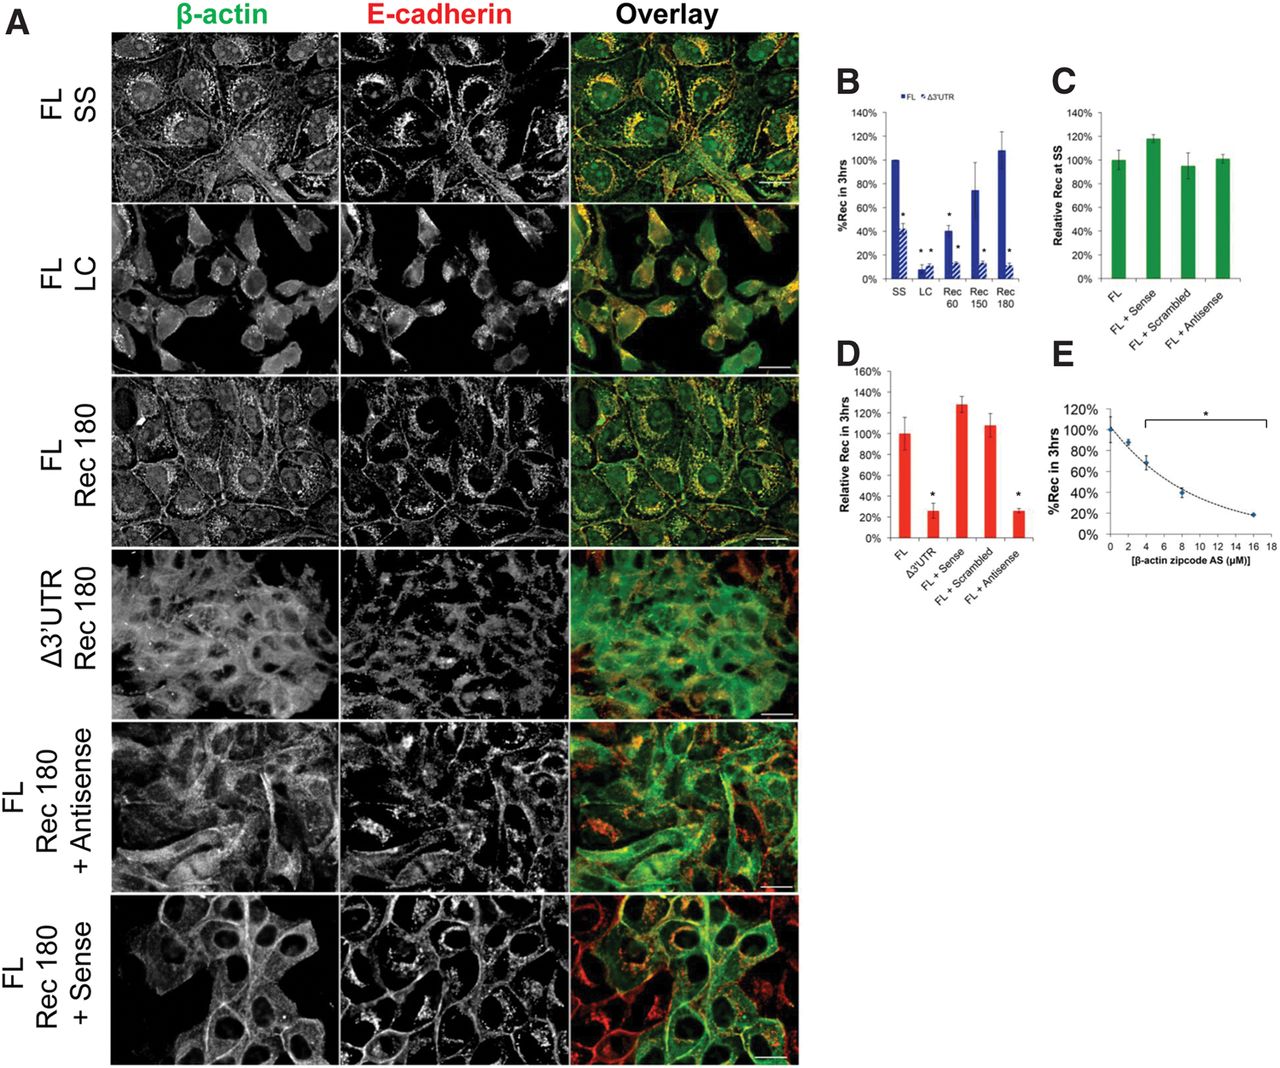
Contact-localized β-actin monomer synthesis stimulates epithelial AJ assembly. De-convolved epifluorescence images of a single plane of MDCK cells during a Ca2+ switch experiment with β-actin (green) labeled with GFP and E-cadherin (red) labeled by immunofluorescence. AJ complexes are identified by β-actin/E-cadherin colocalization (yellow) at cell contact sites. (A) Images are of MDCK cells in a monolayer at steady state expressing FL β-actin (FL SS), 1 h in low Ca2+ media (FL LC), and 3 h post-Ca2+ switch experiment (FL Rec 180). MDCK cells expressing Δ3′ UTR β-actin are shown after 3 h in recovery media (Δ3′ UTR Rec 180). Additionally, MDCK cells were treated with either zipcode antisense (FL Rec 180 + Antisense) or sense (FL Rec 180 + Sense) oligonucleotides during the recovery of a Ca2+ switch experiment. (B) Graph representing the %Rec throughout various time points during a Ca2+ switch experiment in cells either expressing FL β-actin (solid blue) or Δ3′ UTR β-actin (striped blue). (C) %Rec of MDCK cells expressing FL β-actin treated with antisense, sense, and scrambled oligonucleotides for 3 h at SS. Measurements were normalized relative to untreated FL β-actin expressing cells. (D) Graph of the relative %Rec of MDCK cells treated with antisense, sense, and scrambled oligonucleotides. This is the quantification for the phenotype observed in panel A. (E) Dose-dependent curve measuring the %Rec relative to the concentration of zipcode-specific antisense oligonucleotides 3 h post-Ca2+ switch experiment. Scale bars, 20 μm. Error bars show means ± SEM based on five cells in three independent experiments. (*) P < 0.05.




