


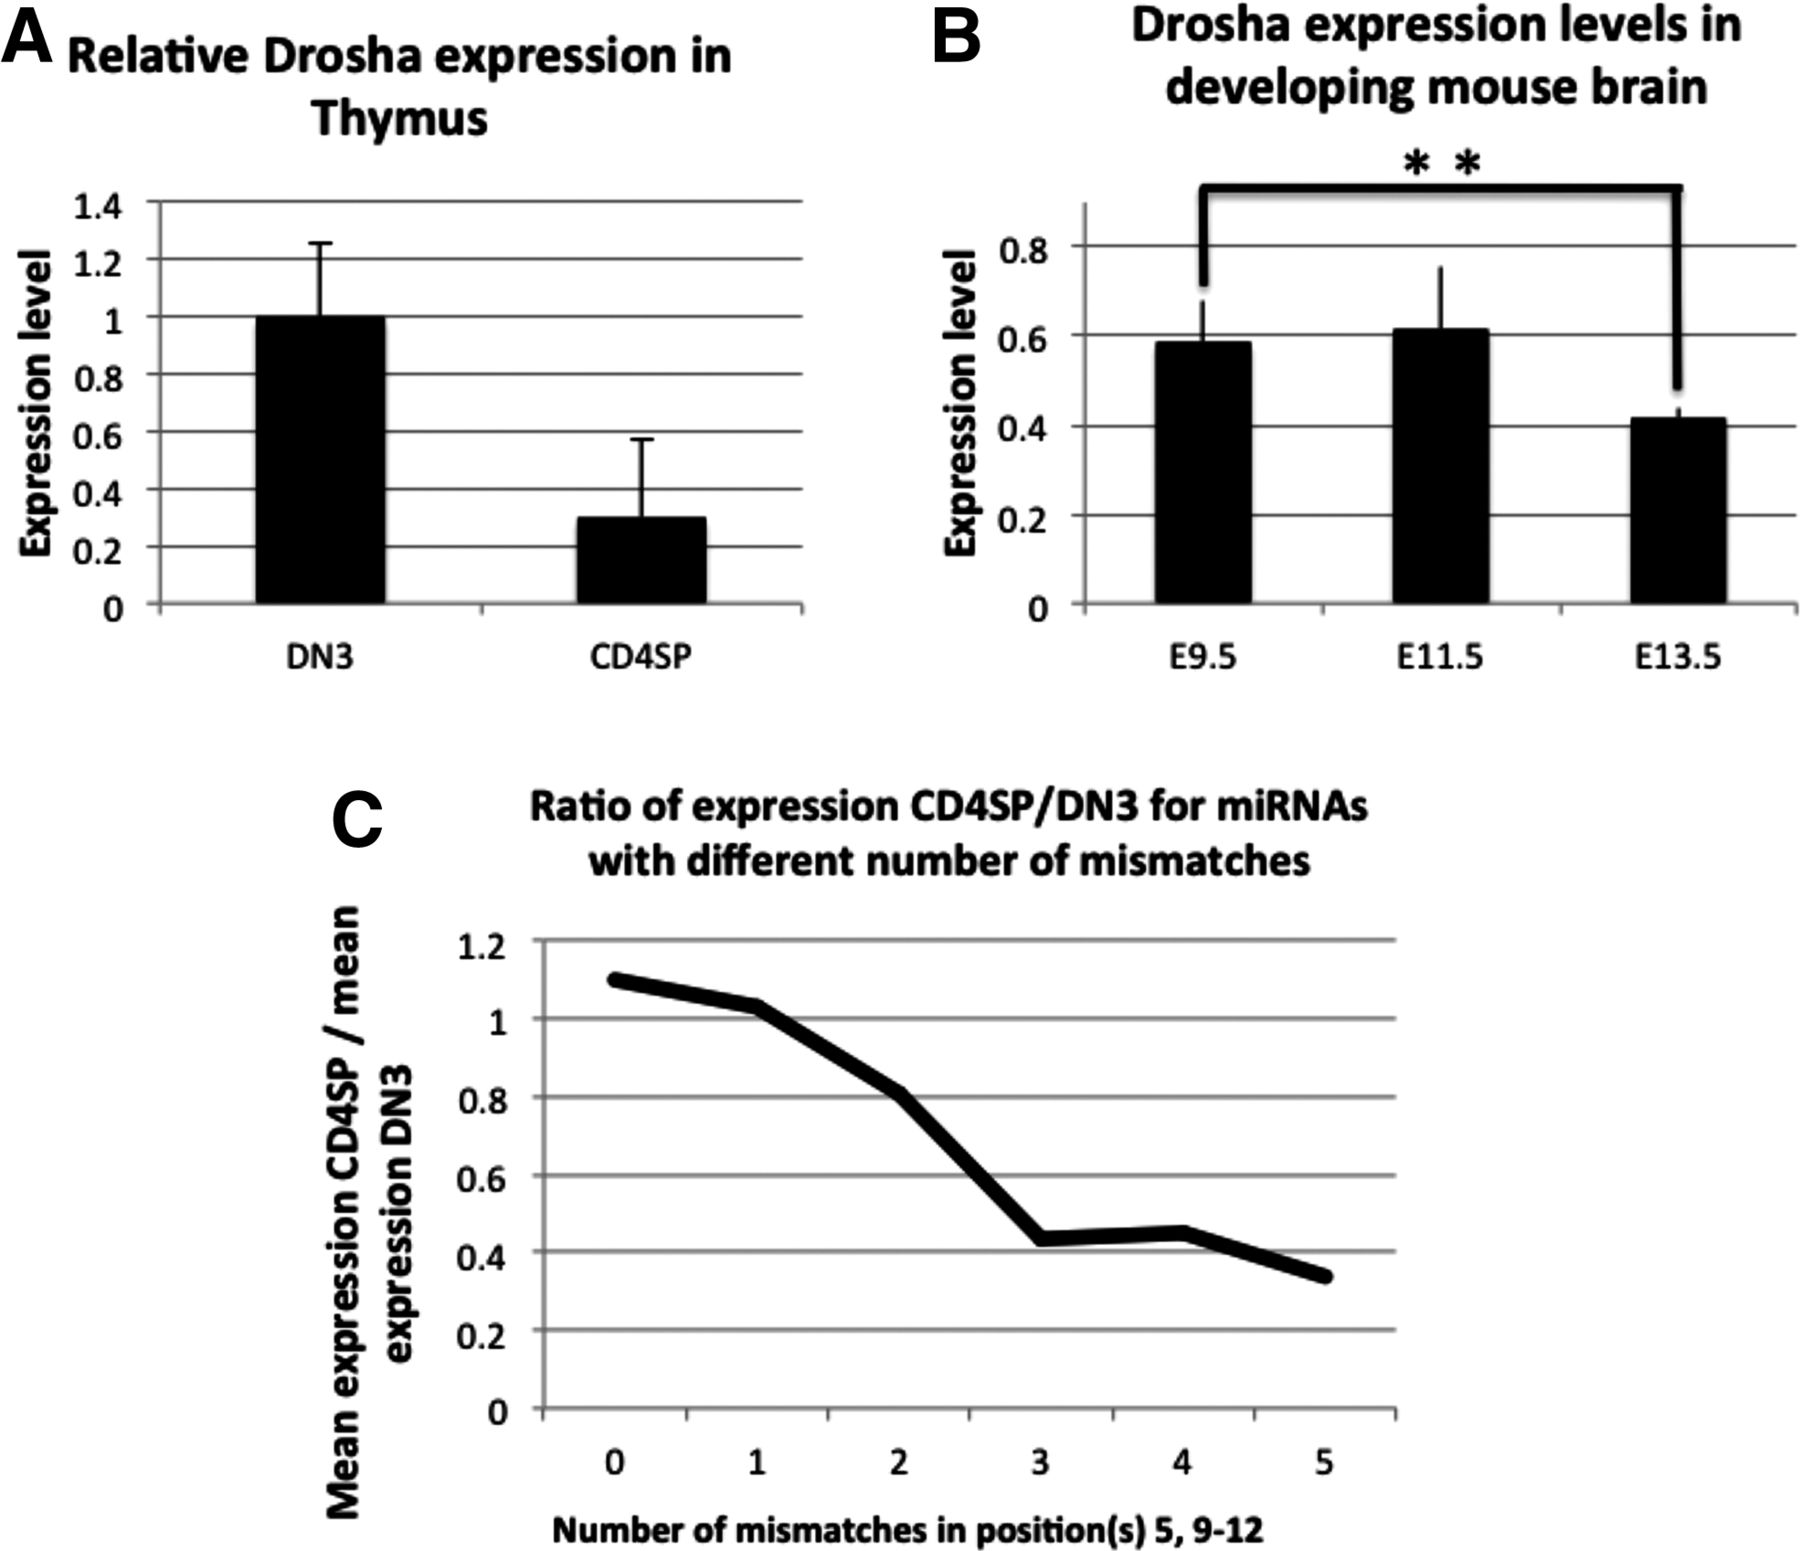
FIGURE 5.
Drosha levels and miRNA profiles during T-cell differentiation. (A) Drosha levels in T-cells measured by qPCR, normalized to β-actin (Chong et al. 2010). (B) Drosha levels in developing mouse brain (GDS3442), normalized to EEF2. (C) Ratio (CD4SP/DN3) of average expression for each miRNA group based on number of mismatches in the 5, 9–12 region.




