


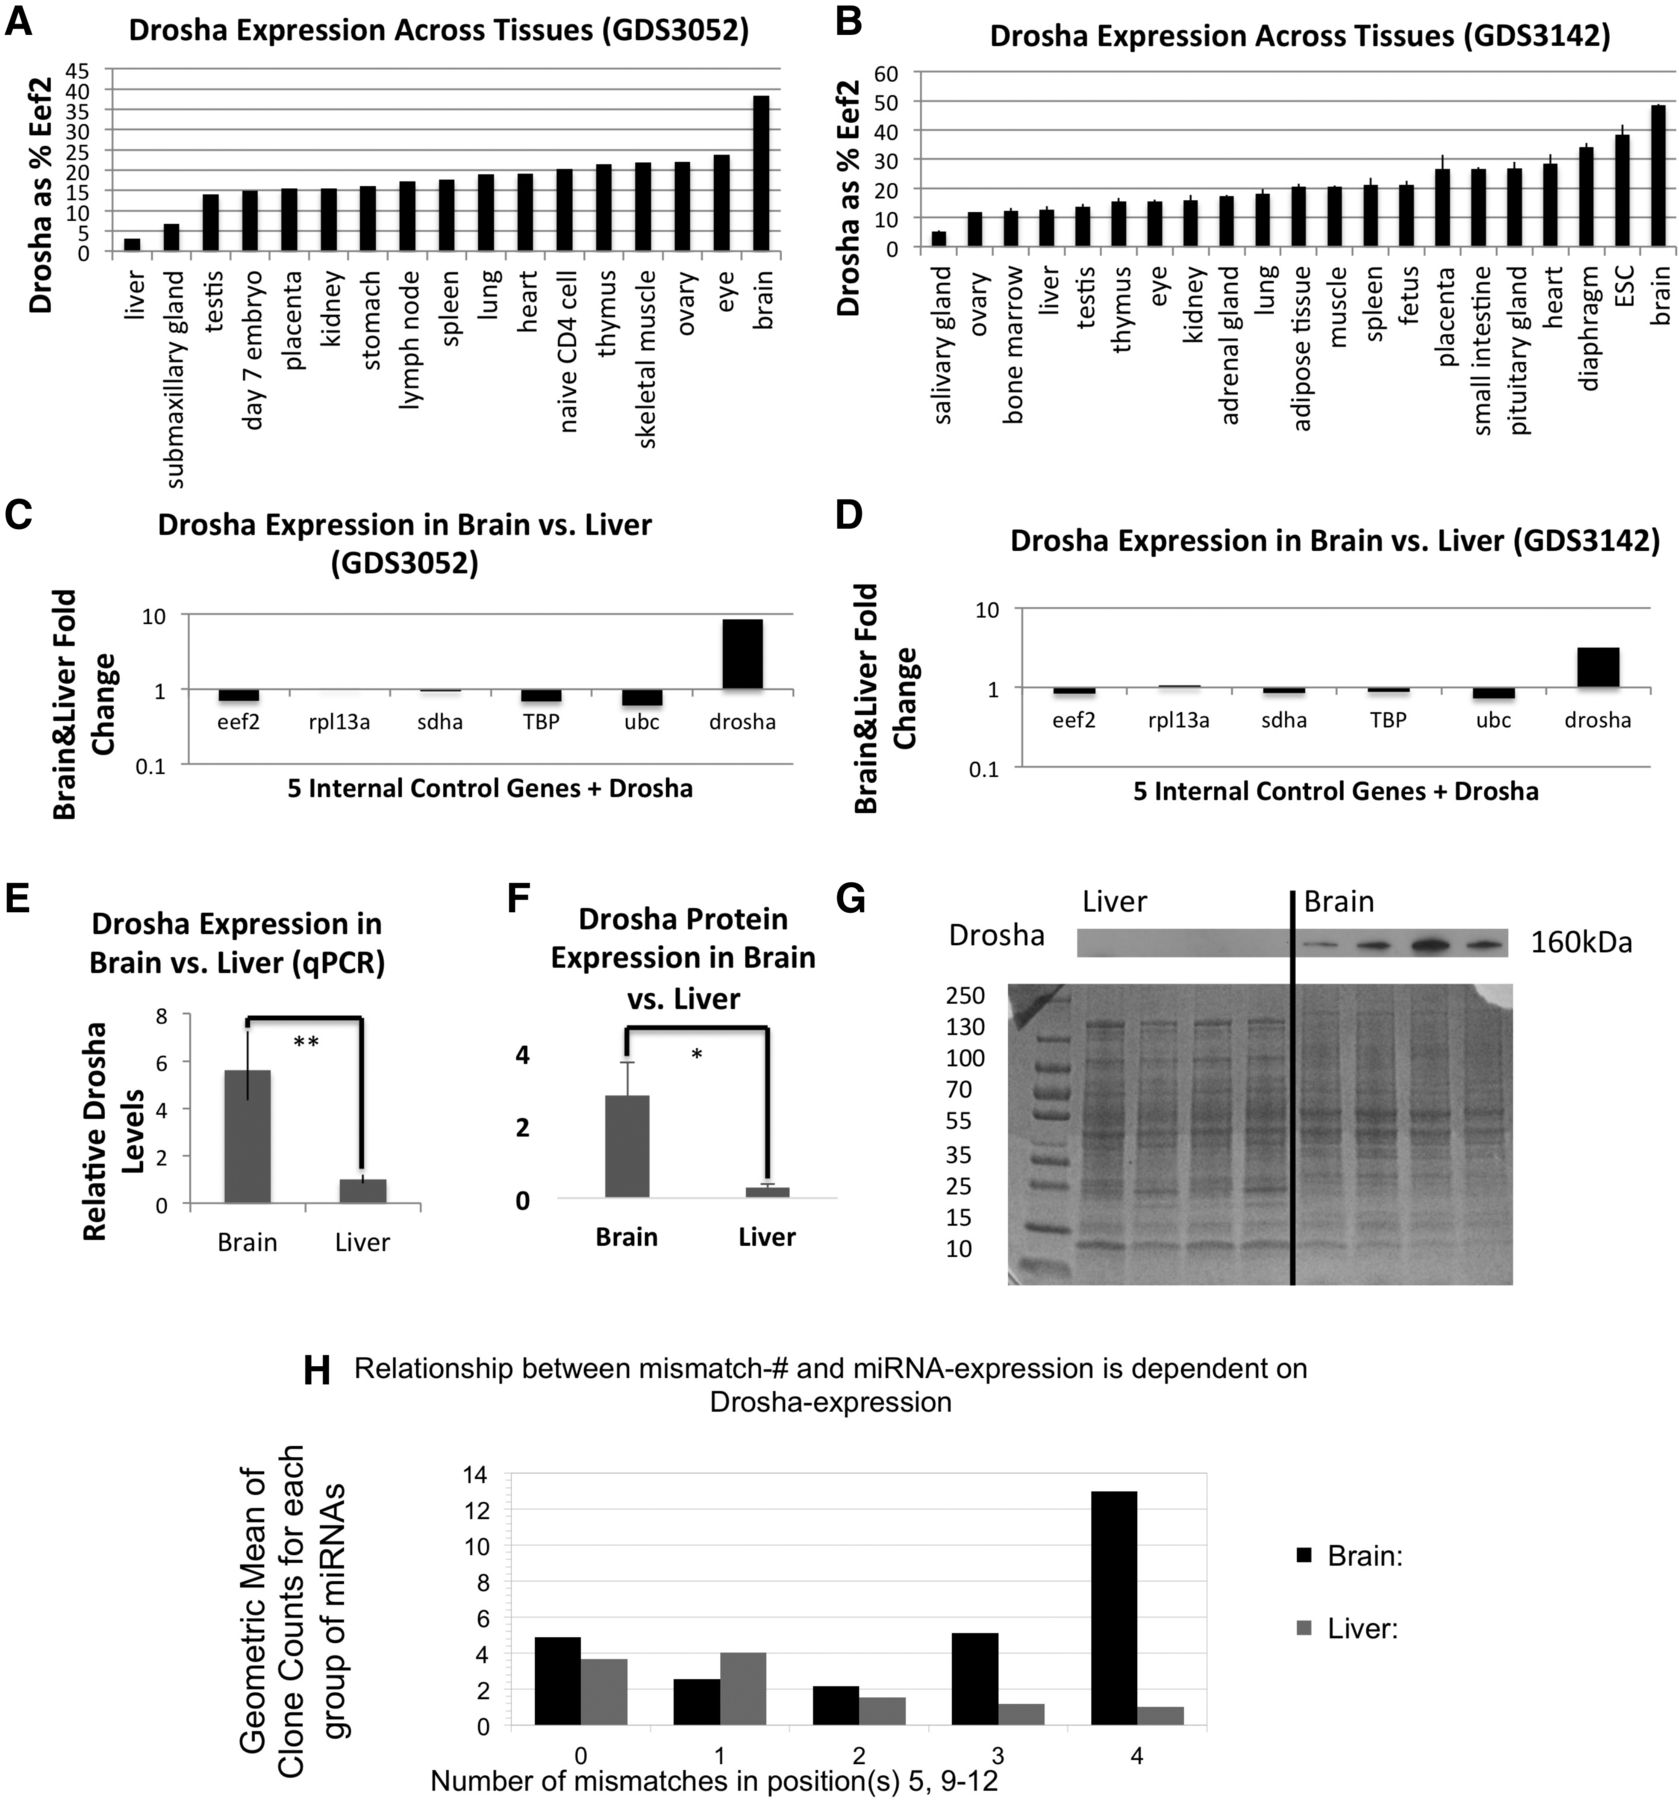
Differential expression of Drosha in mouse tissues. (A,B) Expression levels in Drosha in mouse tissues, normalized to EEF2; GEO(GDS3052) (A), GEO (GDS3142) (B). (C,D) Fold change of Drosha expression in liver, compared with the average expression of EEF2, RPL13A, SDHA, TBP, and UBC; GDS3052 (C), GDS3142 (D). (E) qPCR analysis of Drosha mRNA levels in mouse brain and liver. (F) Quantification of Drosha protein levels show a 9.6-fold increase in brain compared with liver tissue (P < 0.05). (G) Western blot of Drosha protein in mouse brain and liver normalized to total protein (Coomassie Blue). (H) Average expression of miRNAs with different numbers of mismatches in the 5, 9–12 region in mouse liver and brain (Takada et al. 2006).




