


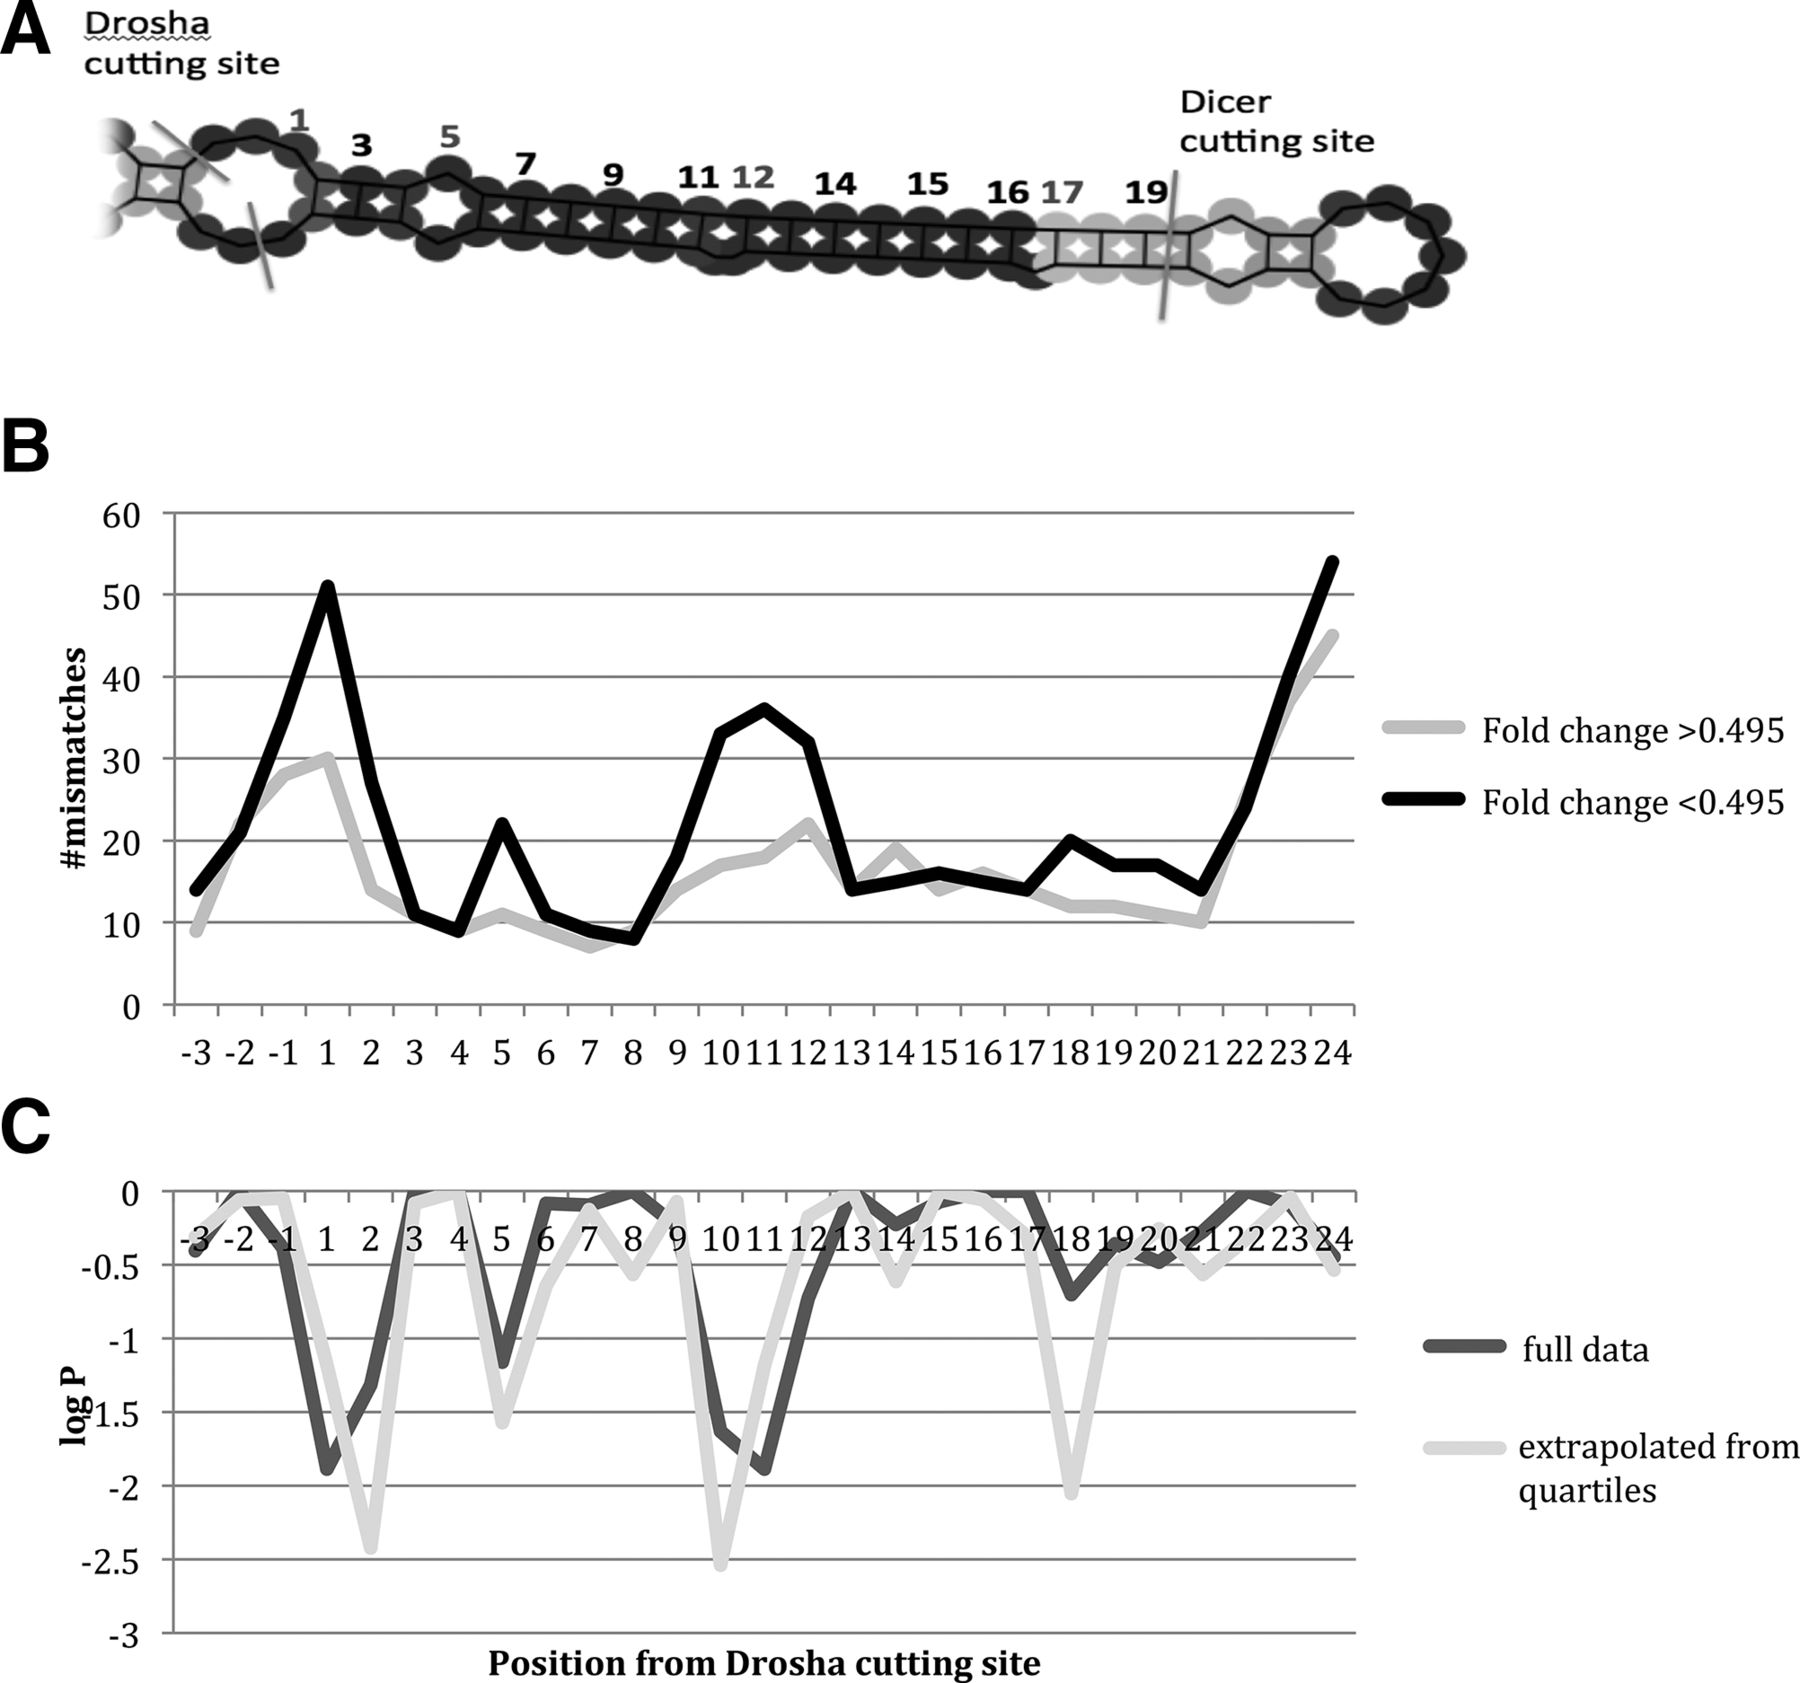
FIGURE 3.
Counting of mismatches in miRNAs in H1 cells with DroshaKD and control cells. (A) Positions regarded as mismatched are marked by numerals in light gray. (B) Mismatches summed for positions counted from the Drosha cutting site for a set of 202 miRNAs split in two equal groups based on fold change in the Drosha knockdown. (C) P-values were calculated using Pearson's χ2 test with Yates’ continuity correction, giving log P-values less than −2 for positions 5, 10, 11, and 12 for the full data set split in half (dark gray) and for the quartiles at the extreme ends with sample size extrapolated to that of the full data set.




