


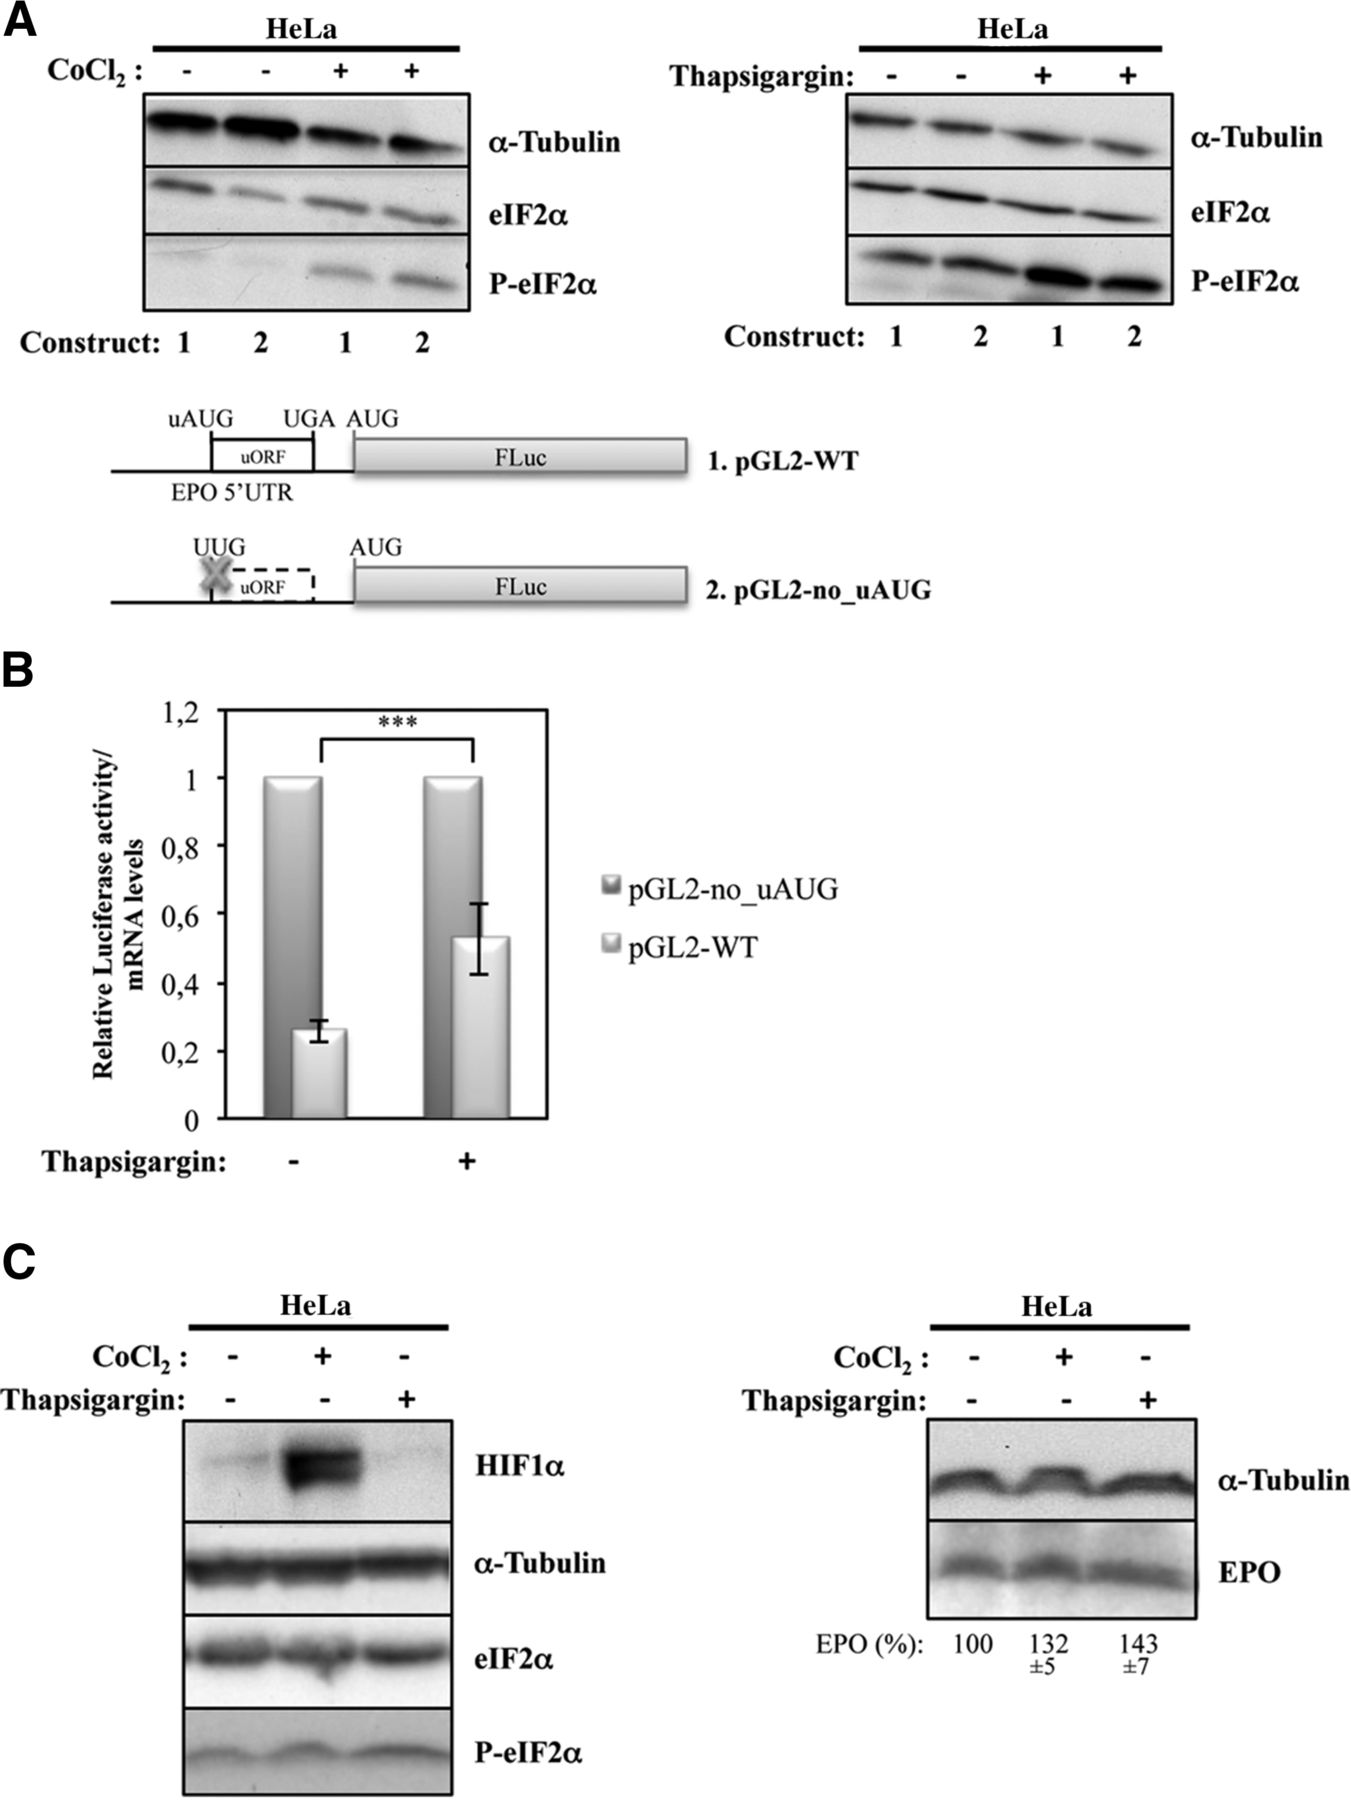
Hypoxia stimulates phosphorylation of eIF2α, which induces EPO translational regulation in HeLa cells. The pGL-WT (construct 1) and pGL2-no_uAUG (construct 2) vectors represented as in Figure 2 were separately cotransfected with a plasmid encoding RLuc (pRL-TK) in HeLa cells. Six hours after transfection, cells were untreated or treated for 24 h with 200 µM CoCl2 to mimic hypoxic conditions or with 1 µM thapsigargin. (A) Representative Western blot analyses of HeLa cell extracts untreated (−) or treated (+) as indicated. Immunoblotting was performed using human eIF2α–specific and human phosphorylated eIF2α–specific antibodies to control for stress conditions and human α-tubulin–specific antibody to control for variations in protein loading. (B) Relative luciferase activity was quantified as described in the legend to Figure 2B. (C) Endogenous EPO protein expression responds to CoCl2 and thapsigargin cellular treatment. (Left) Panel is representative of Western blot analyses of HeLa cell extracts untreated (−) or treated (+) with CoCl2 or thapsigargin, as indicated. Immunoblotting was performed using human HIF1α–specific, human eIF2α–specific, and human phosphorylated eIF2α–specific antibodies to control for stress conditions and human α–specific antibody to control for variations in protein loading. (Right) A representative Western blot of HeLa cell extracts untreated or treated, as in the left panel. Immunoblotting was performed using a human EPO–specific antibody and α-tubulin–specific antibody to control for variations in protein loading. The percentage (%) of endogenous EPO protein expressed in the HeLa cells after treatment, in comparison to that before treatment, is indicated below each lane and was achieved by densitometric analysis using ImageJ software.




