


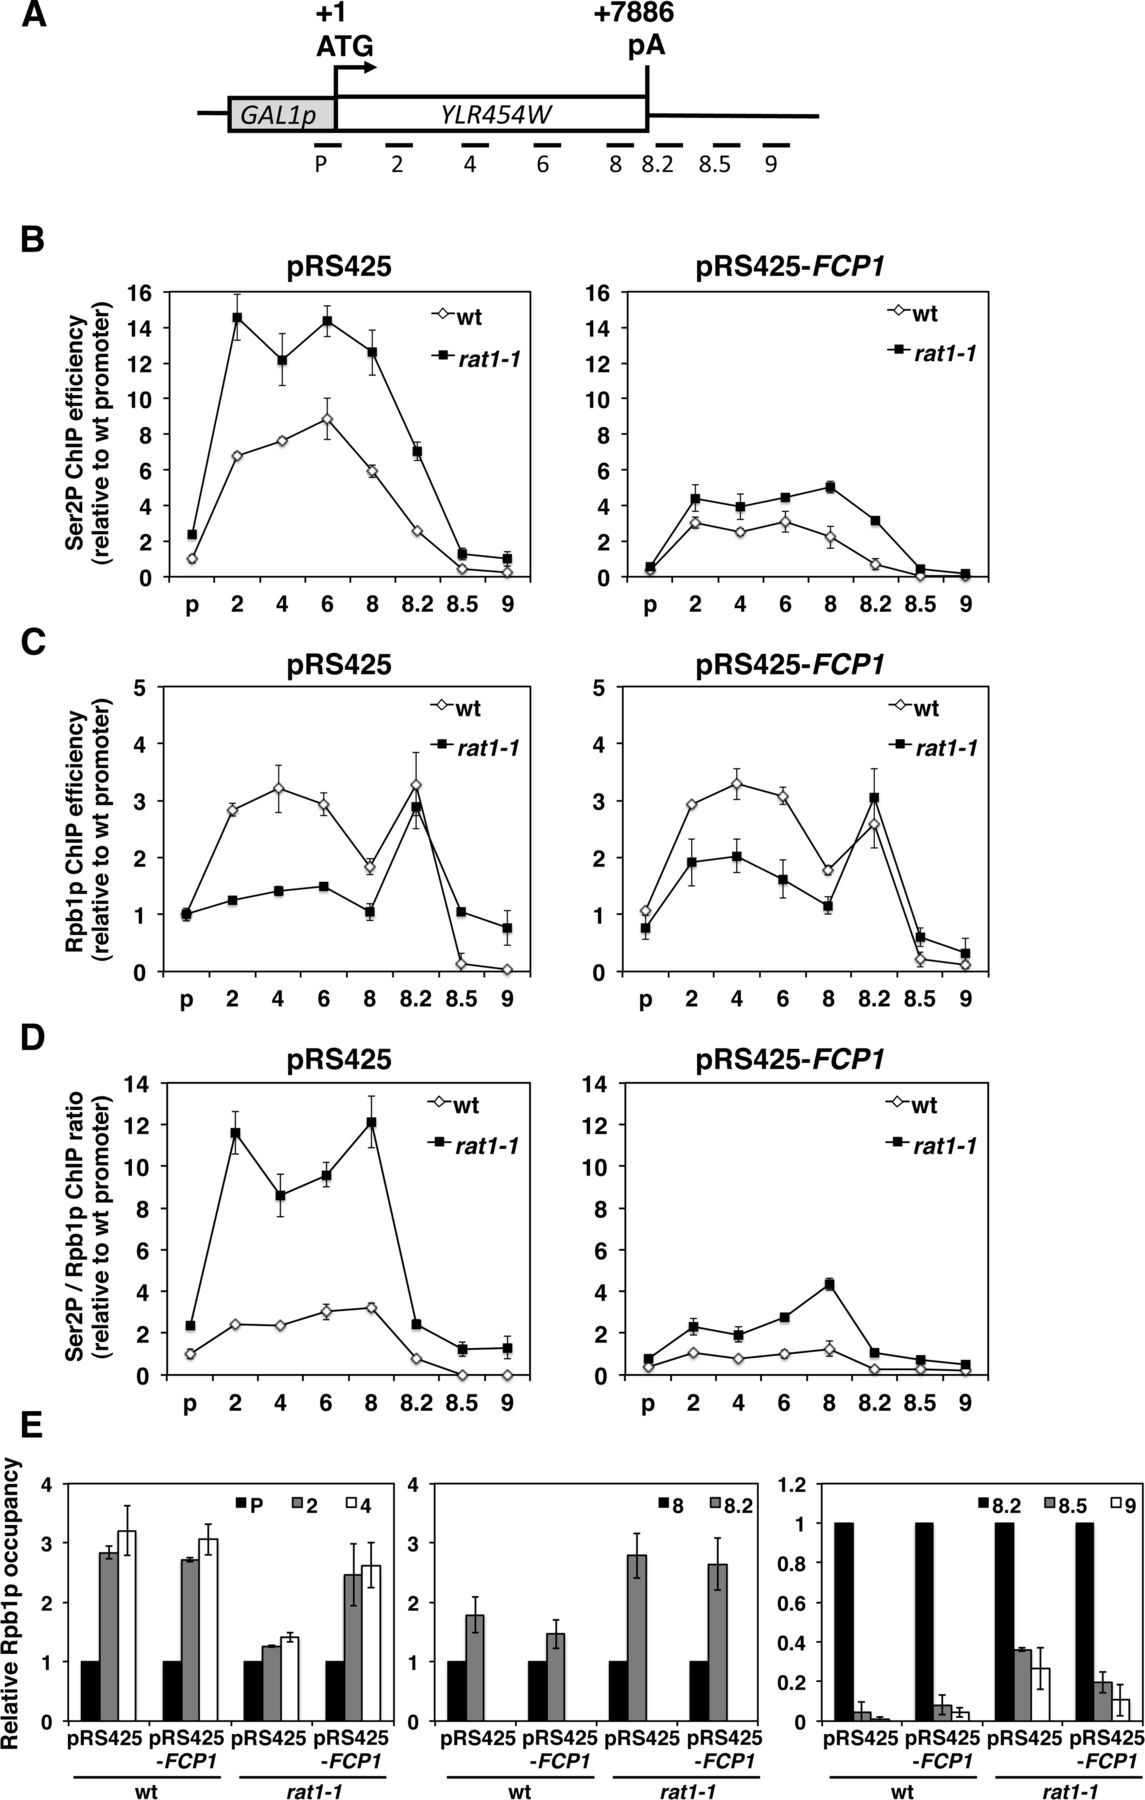
Transcriptional phenotypes of the rat1-1 mutation are rescued by Fcp1p overexpression. (A) Schematic representation of the GAL1::YLR454W system. Promoter is shaded gray, and the transcript unit is white. The transcription start site (TSS) is depicted by an arrow; the major pA site, by a vertical line. Distances (kb) of ChIP amplicons to the reporter TSS are indicated. (B–E) ChIP experiments at the GAL1::YLR454W reporter gene. Cells containing the indicated plasmids were grown in AA-Ura-Leu/2% raffinose at 30°C to an OD600 of 0.6. The GAL1 promoter was induced with 2% galactose for 3 h at 30°C and rat1-1 inactivated by an additional incubation for 1 h at 34°C before fixation. ChIP values are normalized to the signal at the YLR454W promoter region (P) in wt cells containing empty plasmid. Averages and standard deviations of all ChIP data were calculated from three independent biological experiments, each subjected to triplicate quantitative PCR analysis. Data from cells containing empty plasmids (left panels) and cells containing high-copy FCP1 plasmids (right panels) are averages from the same experiments and only split for better visualization. (B) Rpb1 Ser2P distribution measured by the H5 antibody. (C) Total Rpb1p distribution measured by the Y-80 antibody. (D) Ratio between Ser2P and Rpb1p ChIP values in wt and rat1-1 strains. Positions 8.5 and 9 in the wt strain are set to zero since the Rpb1 ChIP levels used for normalization are at background levels in wt cells. (E) ChIP values from C normalized separately for each strain to reveal differences in local changes of Rpb1p distribution at GAL1::YLR454W. (Left) Promoter escape shows occupancy at fragments 2 and 4 normalized to promoter p. (Middle) pA site stalling shows occupancy at fragments 8.2 normalized to fragment 8. (Right) Read-through is fragments 8.5 and 9 normalized to fragment 8.2 separately for each strain.




