


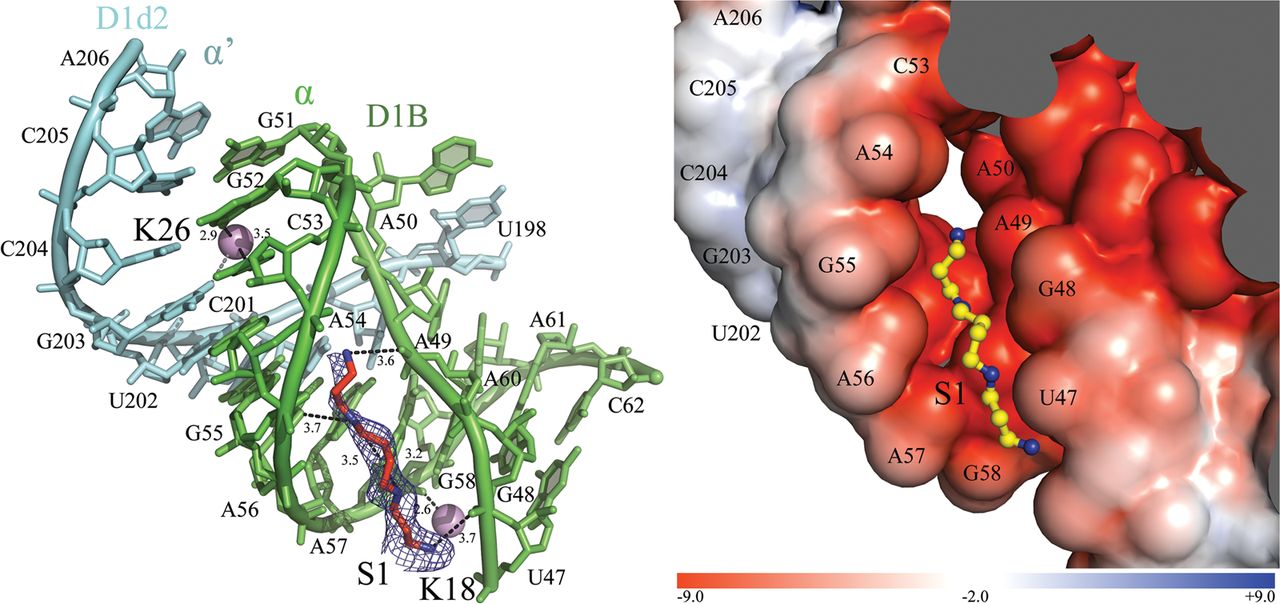
FIGURE 6.
Ionic network at the α–α′ interaction. (Left) The ion-binding sites and the intron residues are colored as described in Figure 2 in the main text. The α–α′ interaction is indicated. Inner-sphere coordination and hydrogen bonds are shown as black dashed lines, with distances in angstroms. The interaction between K26 and O6 of G203 formed only in the presence of Cs+ is colored gray. The simulated annealing Fo–Fc electron density omit map is shown around the spermine molecule as a blue mesh at 3.0 σ. (Right) Electrostatic surface potential around S1. The color scale is indicated at the bottom in units of kT/e.




