


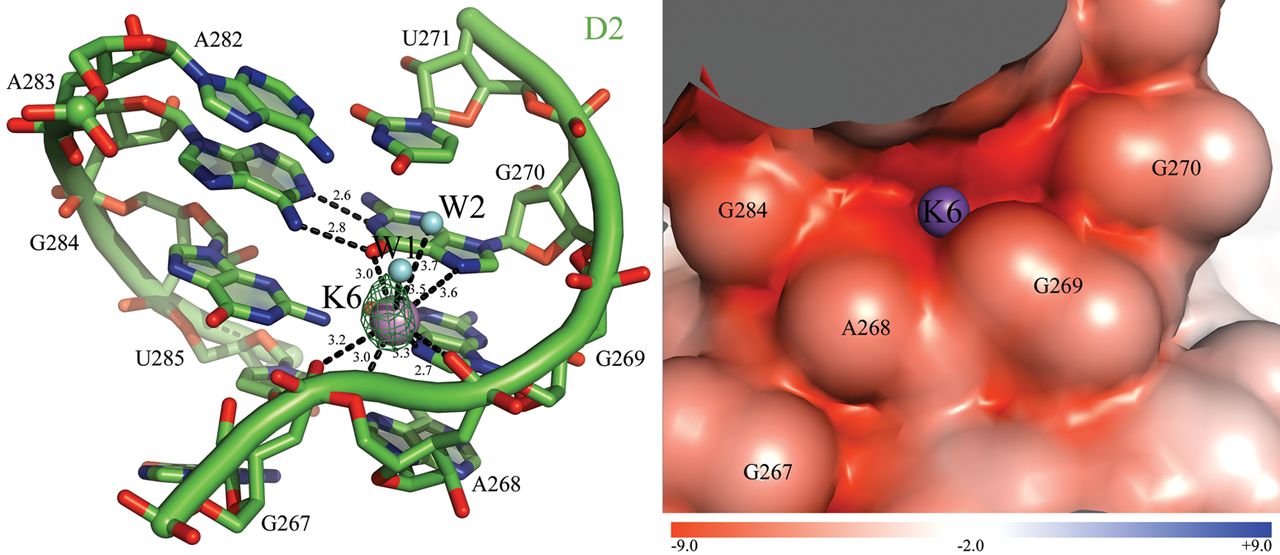
K6 binds an unusual GA imino mismatch in D2. (Left) Coordination of K6. The ion-binding site and the intron residues are colored as described in Figure 2. Inner-sphere coordination and hydrogen bonds are shown as black dashed lines for K6 and for the G270A283 imino mismatch and the corresponding distances are indicated in angstroms. Two water molecules completing the inner solvation sphere of K6 are also visible in the electron density and are represented here as cyan spheres (W1 and W2). Anomalous difference Fourier electron density map at the K6 site is shown as a green mesh at 4.0 σ for Tl+ (PDB id. 4E8Q). (Right) Electrostatic surface potential around K6. The color scale is indicated at the bottom in units of kT/e.




