


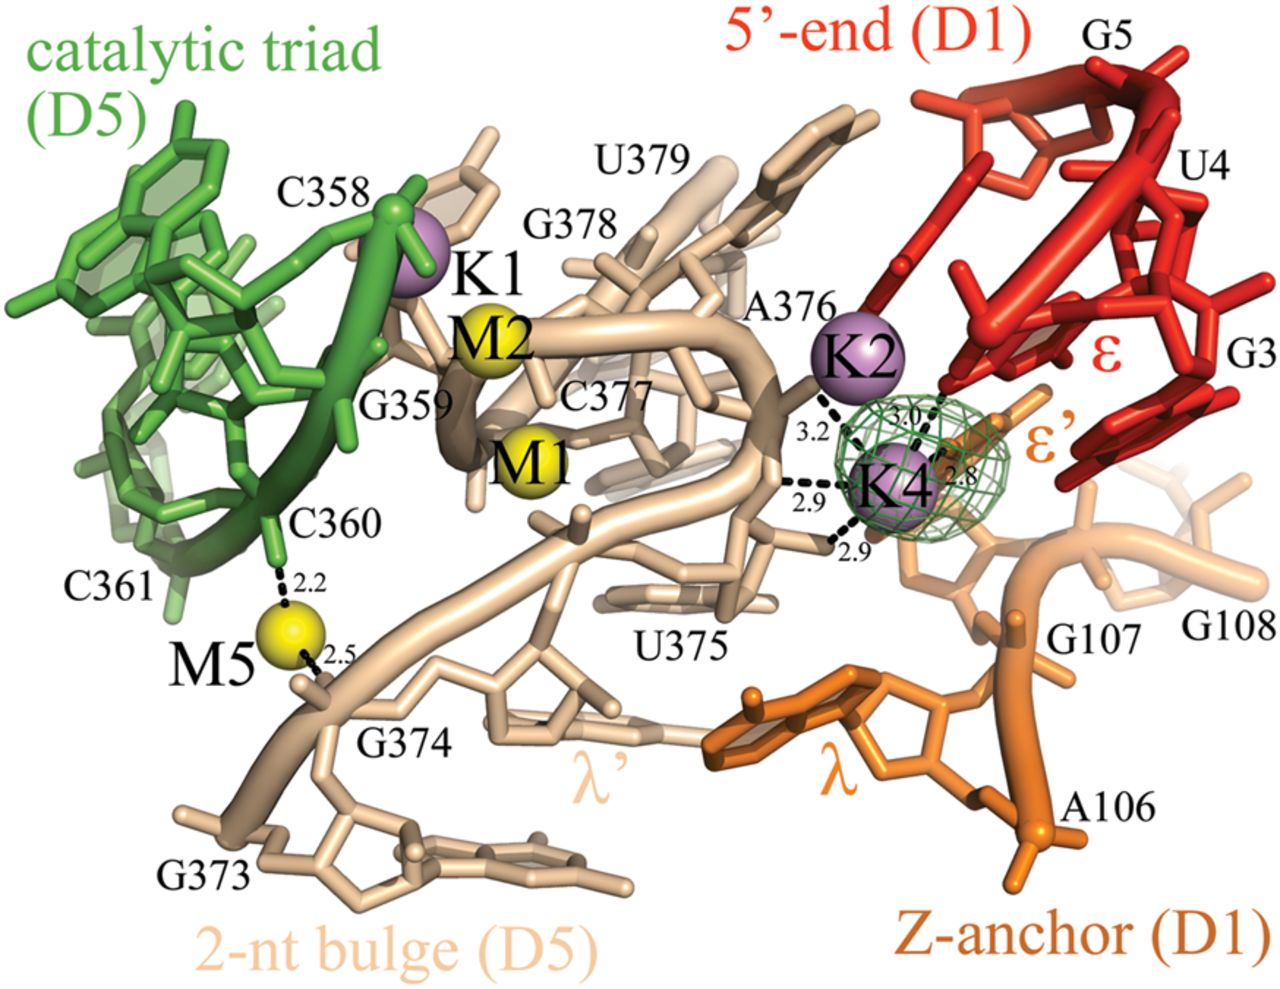
K4 and M5 bind the 2-nt bulge and the Z-anchor. M-sites are depicted as yellow spheres, K-sites as violet spheres, and the intron residues as sticks, color-coded by structural motif. The λ–λ′ and the ɛ–ɛ′ interactions are indicated. Anomalous difference Fourier electron density map at the K4 site is shown as a green mesh at 4.0 σ for Tl+ (PDB id. 4E8Q). At the M5 site, an anomalous difference Fourier electron density peak is visible for Ba2+ (PDB id. 4E8V, data not shown), but not for any monovalent ions. The M1-M2-K1-K2 catalytic center is indicated for reference. Inner-sphere coordination bonds are shown for K4 and M5 as black dashed lines and the corresponding distances are indicated in angstroms.




