


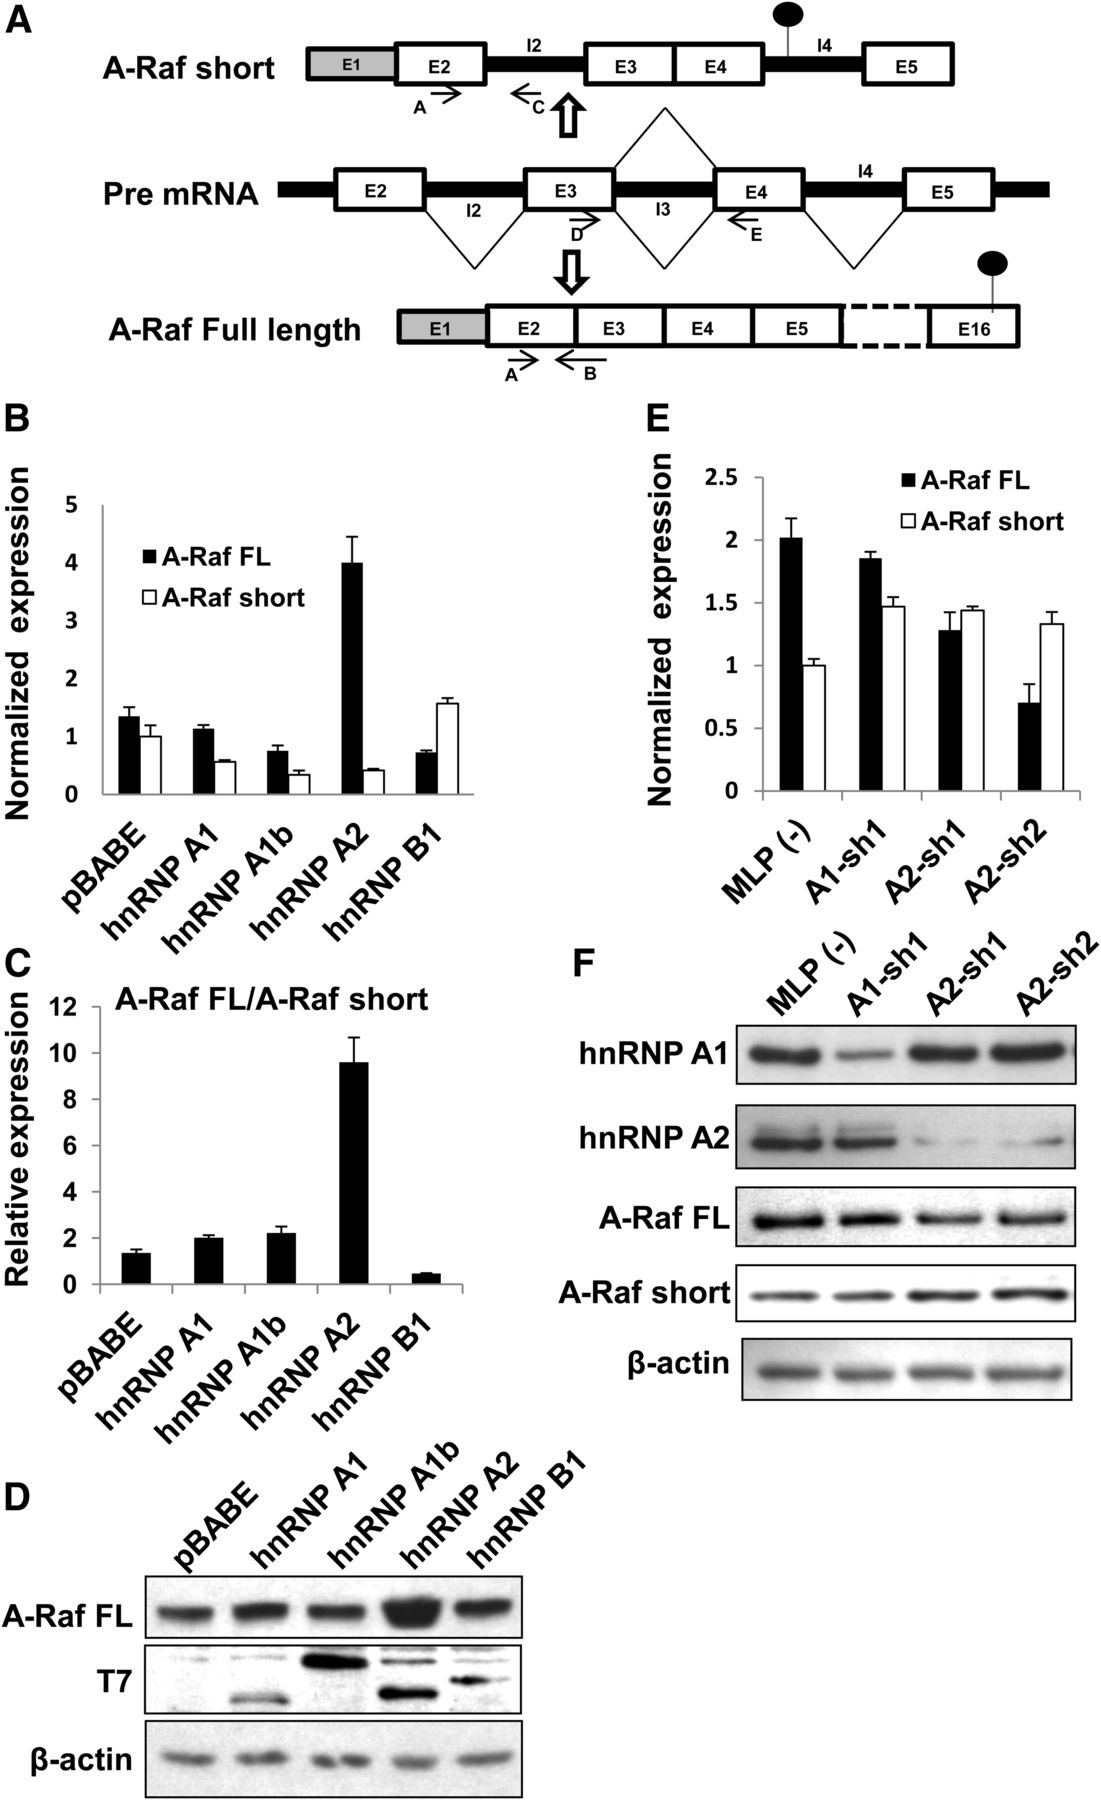
hnRNP A2/B1 regulates A-Raf alternative splicing. (A) A diagram showing intronic and exonic regions of A-Raf regulated by alternative splicing generating the dominant-negative A-Raf short isoform or the FL transcript. Black lines represent introns, empty boxes represent coding exons, gray boxes represent 5′ UTR, and black circles represent stop codons. Arrows represent primer positions. Primer pair A–B was used to detect A-Raf FL isoform. Primer pair A–C was used to detect A-Raf short isoform. Primer pair D–E was used to detect total A-Raf transcripts (see also Supplemental Fig. S5). (B,C) qRT-PCR analysis of A-Raf mRNA isoform expression (B) or the expression ratio of A-Raf FL/A-Raf short (C) in PHM-1 cells transduced with the indicated retroviruses. All samples were normalized to GAPDH mRNA levels and to the expression of the A-Raf short isoform in control (empty vector, pBABE) cells (B) or to the A-Raf FL/A-Raf short ratio in control (pBABE) cells (C), which was arbitrarily set at one (mean ± SEM; n = 3). (D) Immunoblot analysis of A-Raf FL and T7-TAG in cells described in B and C; β-actin was used as loading control. (E) qRT-PCR analysis of A-Raf isoforms in HuH7 cells transduced with retroviruses encoding for specific shRNAs against either hnRNP A1 or hnRNP A2. All samples were normalized to β-actin mRNA levels and to the expression of the A-Raf short isoform in control (empty vector without shRNA, MLP) cells, which was arbitrarily set at one (mean ± SEM; n = 3). (F) Total protein from cells described in E was extracted, and the expression levels of hnRNP A1/A1b, hnRNP A2/B1, A-Raf FL, and A-Raf short were assessed by Western blotting. β-Actin was used as a loading control.




