


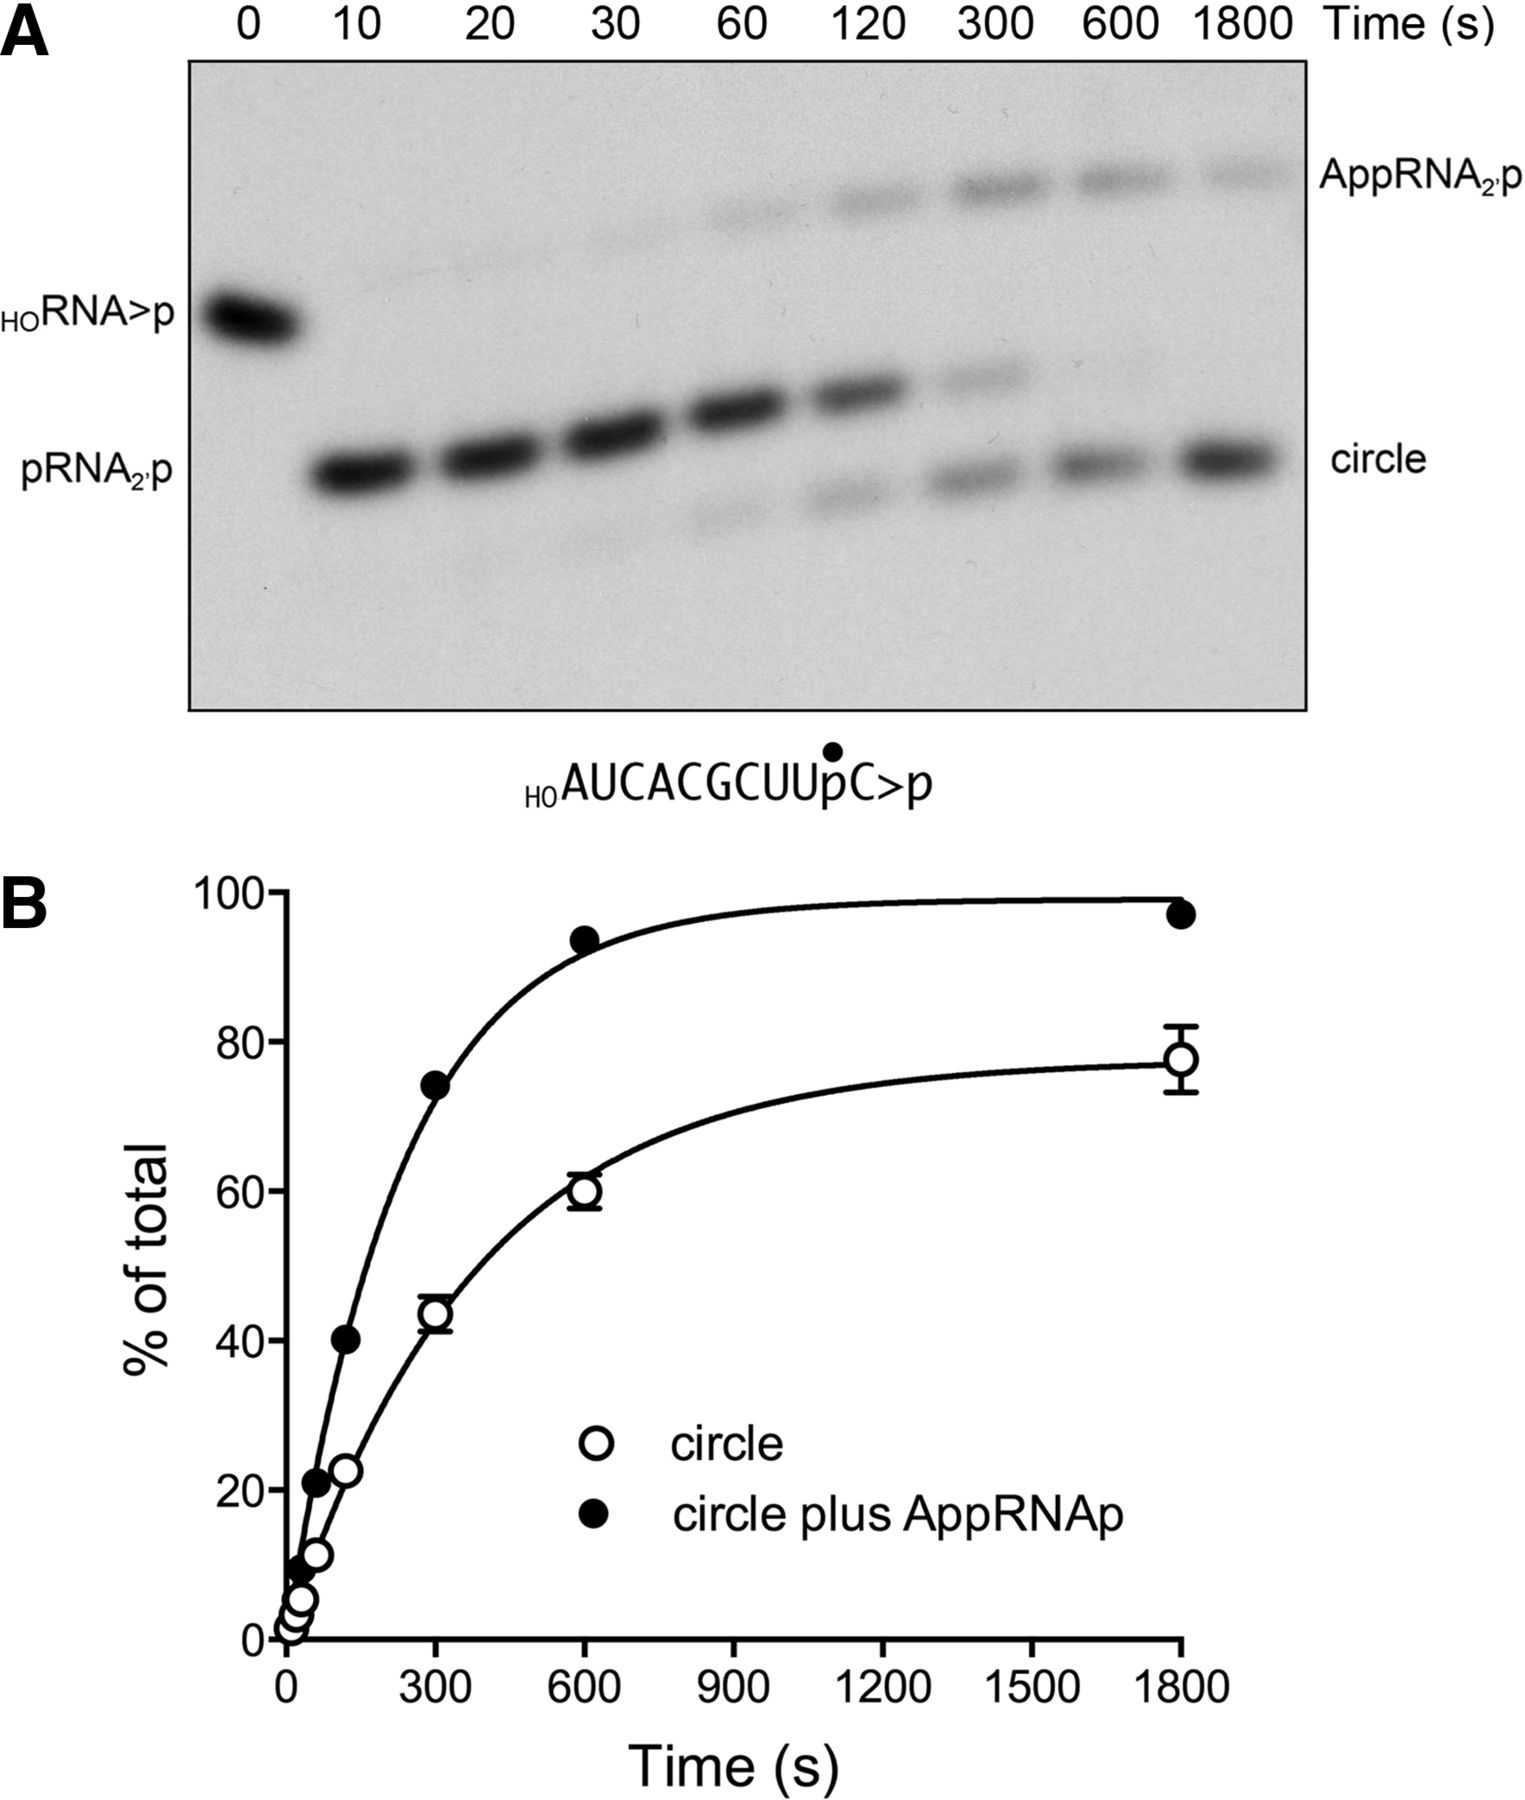
Reaction of KlaTrl1 with a 10-mer HORNA>p substrate. A reaction mixture (200 µL) containing 50 mM Tris-HCl, pH 8.0, 2 mM DTT, 10 mM MgCl2, 100 µM ATP, 100 µM GTP, 20 nM 3′ 32P-labeled 10-mer HORNA>p substrate (depicted at the bottom of panel A with the 32P-label denoted by •), and 1 µM KlaTrl1 was incubated at 22°C. Aliquots (20 µL) were withdrawn at the times specified and quenched immediately. The products were analyzed by urea-PAGE. An autoradiogram of the gel is shown in panel A. The position and identities of the radiolabeled substrate and products are indicated on the left and right. The extent of ligation (circle/total RNA) and the extent of RNA adenylylation ([AppRNAp + circle]/total RNA) are plotted as a function of time in panel B. Each datum is the average of three separate time-course experiments ±SEM. Nonlinear regression curve fits of the data to a single exponential are shown.




