


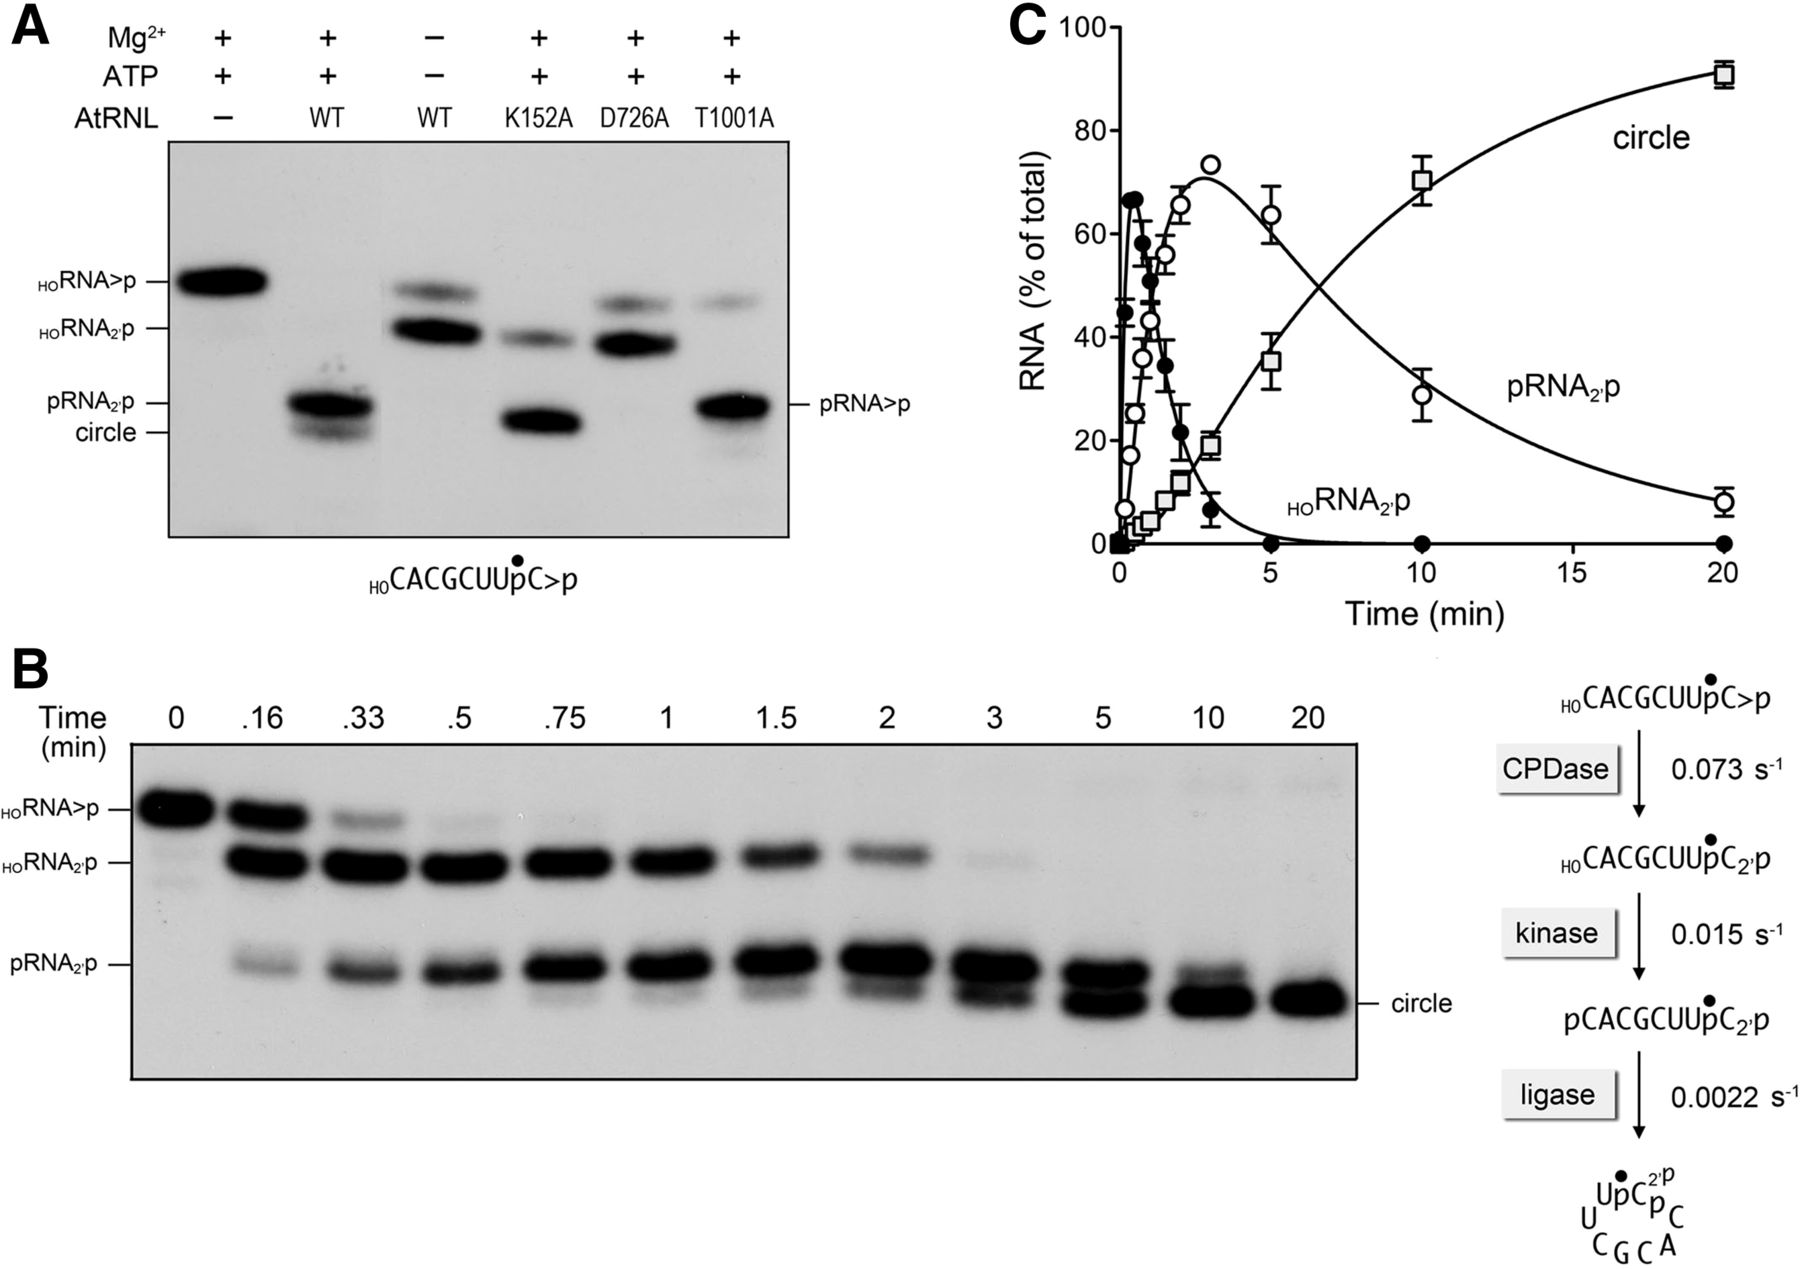
Reaction of AtRNL with an 8-mer HORNA>p substrate. (A) Wild-type AtRNL and the indicated mutants were reacted with a 3′ 32P-labeled 8-mer HORNA>p substrate (depicted at the bottom of the panel with the 32P-label denoted by •). Reaction mixtures (20 µL) containing 50 mM Tris-HCl, pH 8.0, 50 mM NaCl, 2 mM DTT, 10 mM MgCl2, 100 µM ATP, 20 nM 8-mer HORNA>p, and 1 µM AtRNL (wild-type or mutant as specified) were incubated for 5 min at 22°C. The reactions were quenched with formamide, EDTA, and the products were analyzed by urea-PAGE. An autoradiograph of the gel is shown. The position and identities of the radiolabeled RNA substrate and the various healed or sealed products are indicated on the left and right. (B,C) Single-turnover kinetics. A reaction mixture (250 µL) containing 50 mM Tris-HCl, pH 8.0, 50 mM NaCl, 2 mM DTT, 10 mM MgCl2, 0.1 mM ATP, 20 nM 8-mer HORNA>p substrate, and 1 µM AtRNL was incubated at 22°C. Aliquots (20 µL) were removed at the times specified and quenched immediately with formamide, EDTA. The time 0 sample was withdrawn and quenched prior to adding AtRNL. The products were resolved by urea-PAGE. An autoradiogram of the gel is shown in panel B. The levels of the healed HORNA2′p and pRNA2′p intermediates and the ligated circle product were quantified by scanning the gel and are plotted as a function of time in panel C. Each datum is the average of three separate time-course experiments ±SEM. The data were fit by nonlinear regression in Prism to a sequential three-step reaction pathway shown at right in panel B. The apparent rate constants for the CPD, kinase, and ligase reactions are indicated.




