


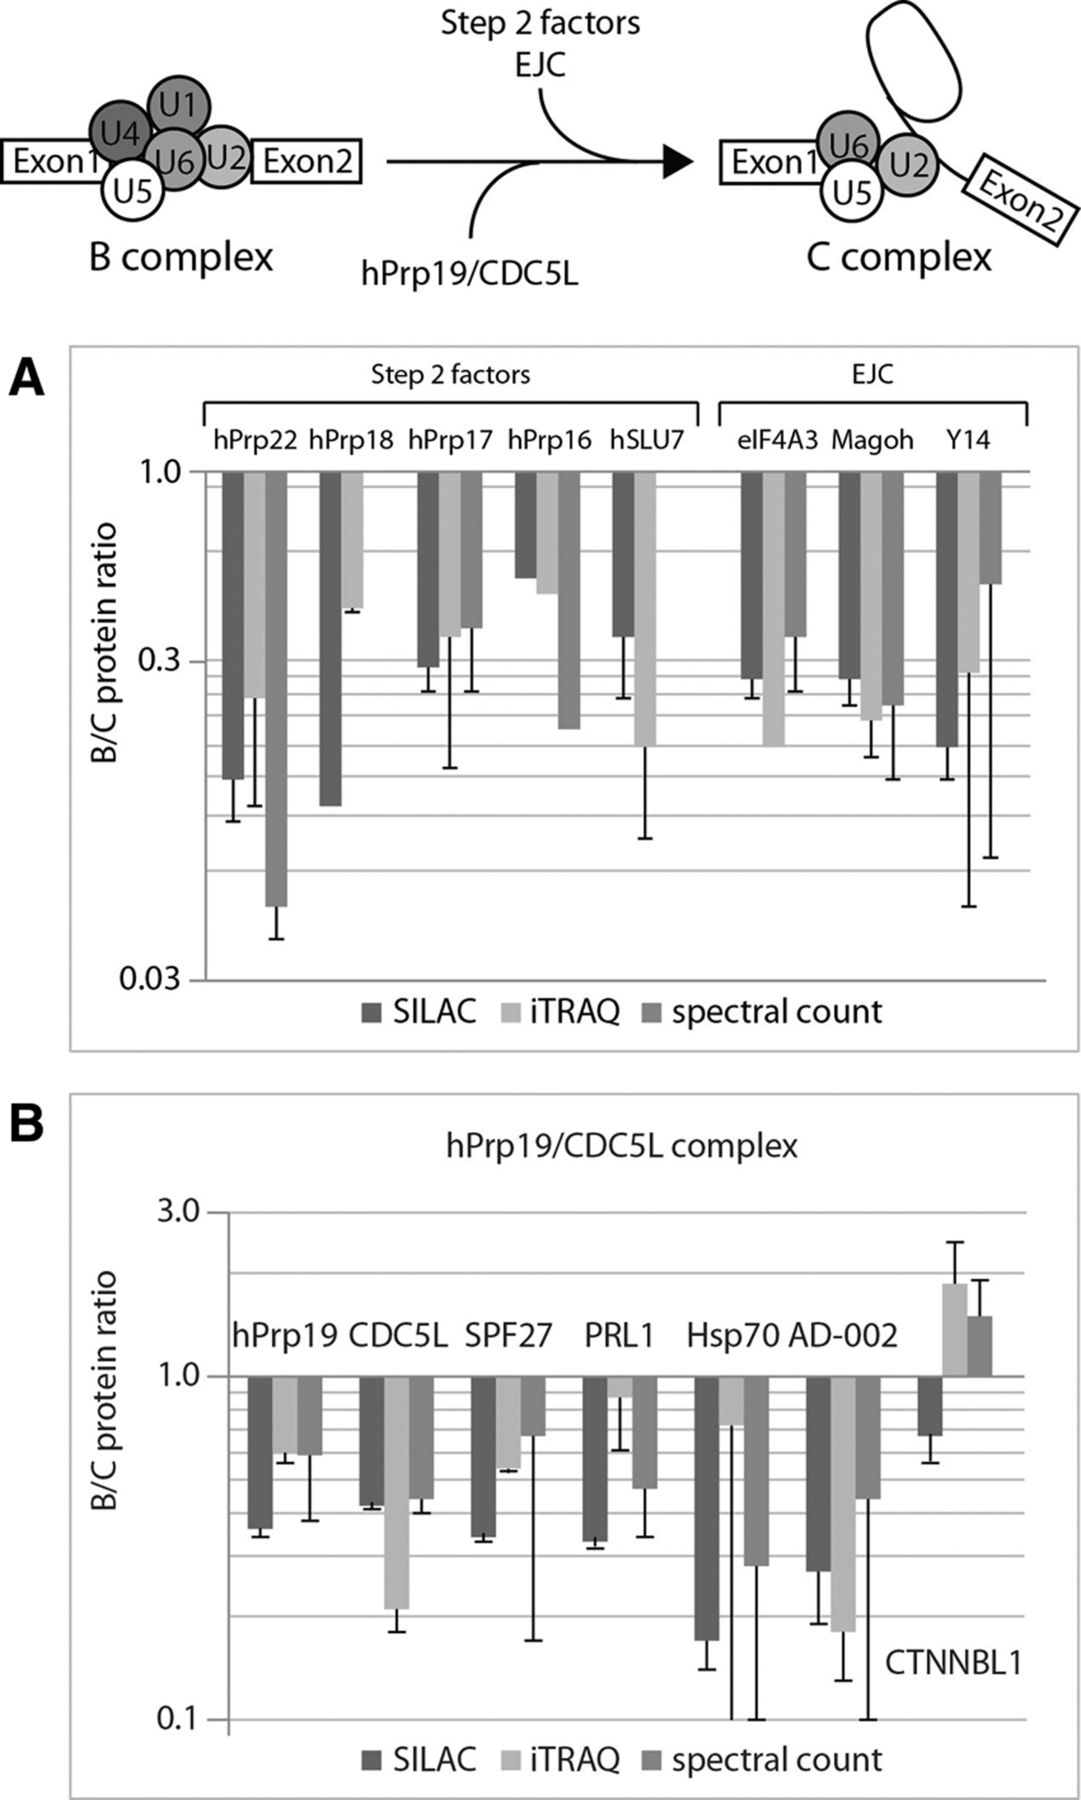
FIGURE 6.
Relative protein abundances of the step 2 factors, the EJC and the hPrp19/CDC5L complex–specific proteins obtained by SILAC, iTRAQ, and spectral count. (A) B:C ratios for step 2 factors and the EJC. No protein ratio was obtained from the spectral count for hPrp18 since this protein was absent from the B complex. (B) B:C ratios for the hPrp19/CDC5L complex–specific proteins. For CTNNBL1, no clear association to either the B or the C complex could be determined. For details, see legend to Figure 3.




