


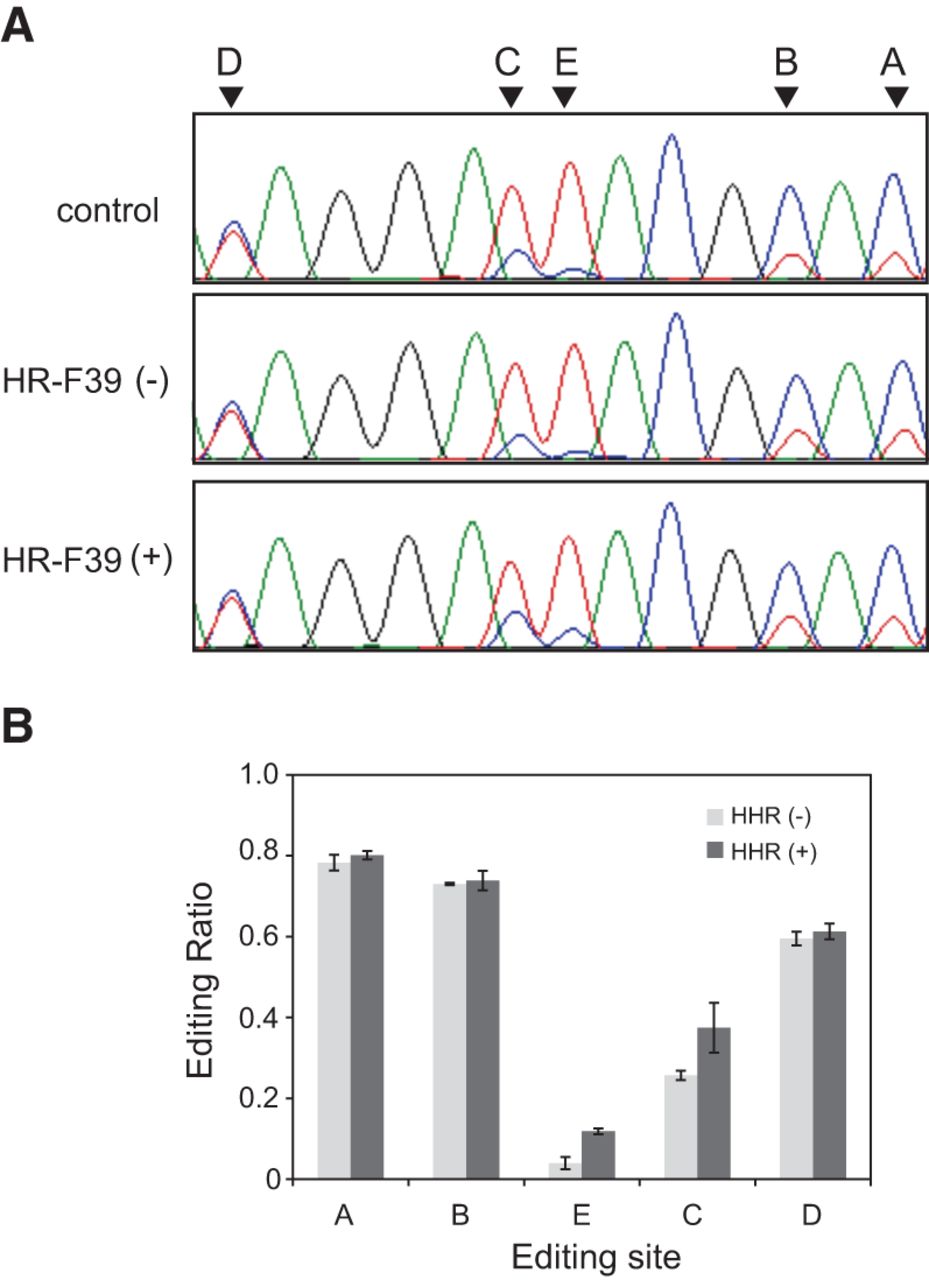
Analysis of the effect of editing state at the E and/or C sites on editing at the other sites on HTR2C mRNA. (A) Sequence chromatograms of the RT-PCR products with and without the cleavage reaction by HR-F39. Chromatograms, which were generated using reverse HTR2C-specific primers, are shown for the sequences obtained from intact HTR2C mRNA (upper), incubation only (without cleavage reaction) (middle), and after the reaction with HR-F39 for 30 min (lower). Red and blue peaks represent the signals from T and C, respectively. Each editing site is indicated using an arrowhead. (B) Comparison of editing ratios at each editing site with and without cleavage reaction. The bar graph shows the editing ratios at each editing site from the HR-F39 reaction (dark gray bars) and without the reaction (light gray bars). Editing ratios were quantified by the same method as in Figure 5C. Results are presented as the average editing ratio and standard deviation from three independent experiments.




