


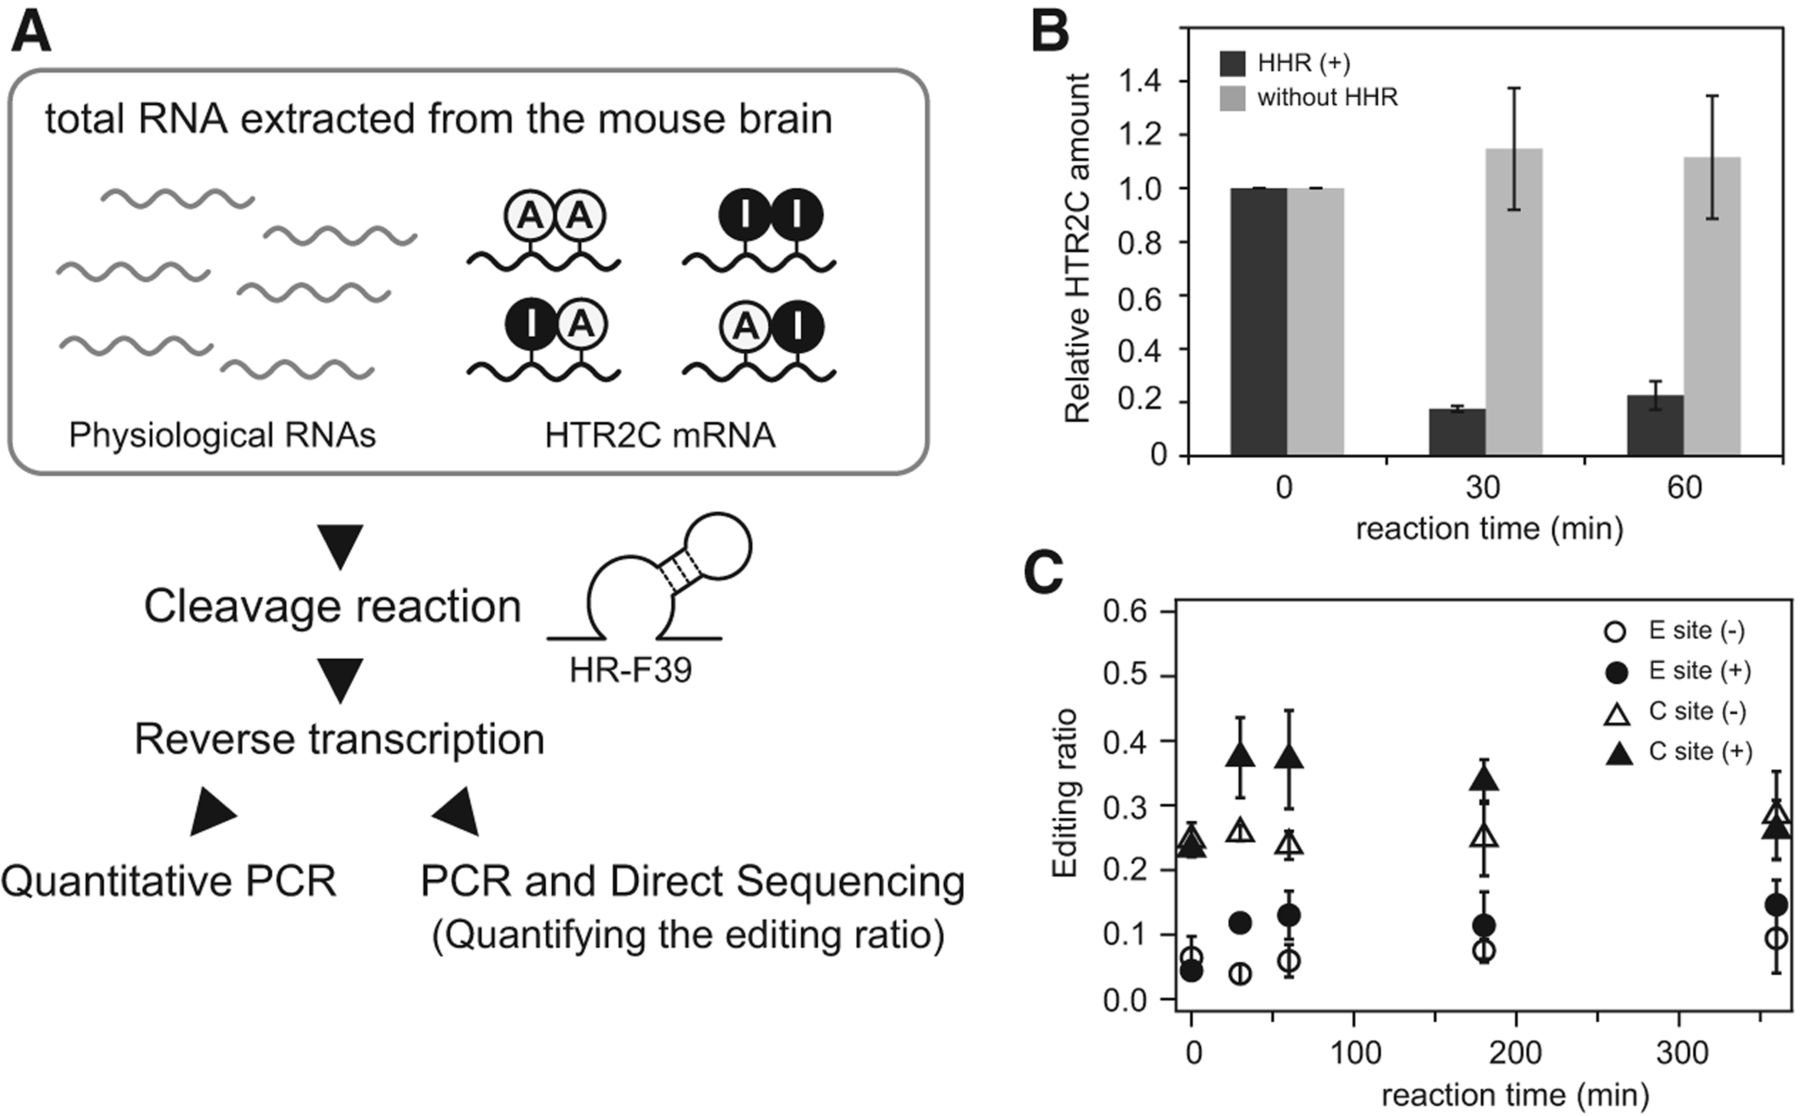
In vitro unedited-specific cleavage activity of HR-F39 against HTR2C mRNA extracted from mouse brain. (A) Experimental procedure for analyzing the unedited-specific cleavage activity of HR-F39 against extracted HTR2C mRNA using RT-qPCR and measuring the change in editing ratio at the E and C sites. First, total RNA containing HTR2C mRNA was extracted from mouse brain. Among the extracted total RNA, the possible combinations of editing states at the E and C site (E-C) of HTR2C mRNA are A-A, A-I, I-A, and I-I. Next, to perform unedited-specific cleavage, extracted HTR2C mRNA was reacted with HR-F39 in the total RNA solution. A control sample was generated by omitting HR-F39. Then, the resulting RNAs were subject to reverse transcription to generate HTR2C cDNA. To analyze cleavage efficiency, qPCR was performed with HTR2C cDNA generated as described above. The efficiency for unedited-specific cleavage was assessed by measuring the change in the editing ratio calculated from the sequence chromatogram generated by direct sequencing of the RT-PCR product. (B) Reduced HTR2C mRNA after the HR-F39 cleavage reaction. The graph shows relative HTR2C mRNA quantities normalized to that at time zero. The amount of each HTR2C mRNA was calculated relative to that of GAPDH, which was used as an internal standard for the total RNA quantity. (C) Change in the editing ratio at the E and C sites over time with HR-F39. The graph shows the editing ratio at the E and C sites as a function of time for the cleavage reaction. Each editing ratio was quantified by measuring the peak heights of T and C generated from the direct-sequencing chromatograms and calculated as follows: (height of the C peak)/(height of C peak + height of T peak). Circles and triangles represent the editing ratio at the E and C sites, and open and closed symbols indicate without and with HR-F39, respectively. The results of B and C are presented as averages and standard deviations from three independent experiments.




