


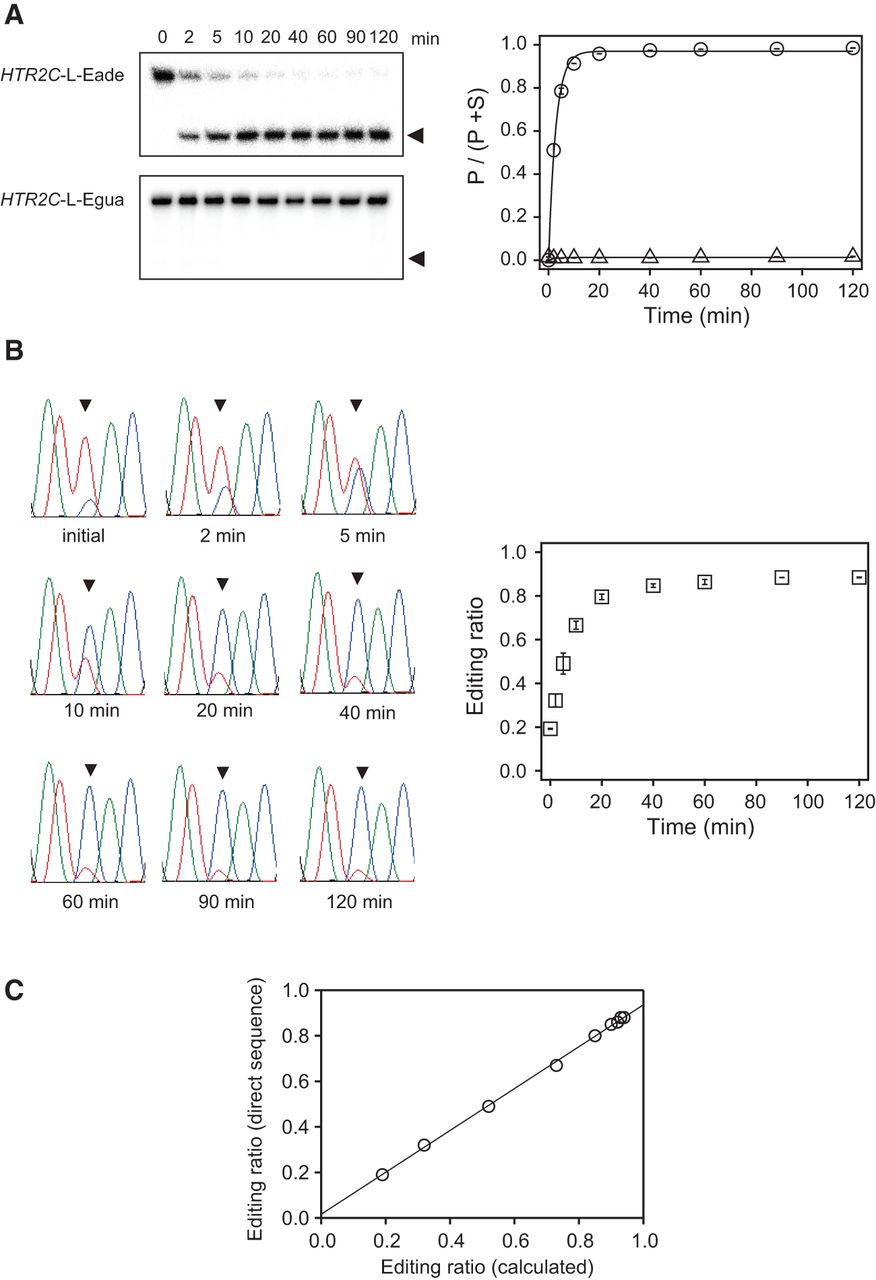
Efficiency of unedited-specific cleavage against long target RNA as assessed by analytical PAGE and direct sequencing. (A) Denaturing PAGE (15%) shows the cleavage activity of HR-F39 for HTR2C-L-wt (upper) and HTR2C-L-Egua (lower), in which adenosine at the E site was substituted to guanosine as an analog for inosine. Positions of the uncleaved substrate and the resulting 5′-cleavage products are indicated. Graphs represent the cleavage ratio as a function of reaction duration. Each data point for individual sets of ribozyme and substrate (ribozyme/substrate) is represented as circles (HR-F39/HTR2C-L-wt) and triangles (HR-F39/HTR2C-L-Egua). (B) Analysis of unedited-specific cleavage activity by direct sequencing. The sequencing chromatograms generated with the reverse primer are shown at different durations of the cleavage reaction. Red and blue peaks represent T and C, respectively. The duration of the cleavage reactions is represented under each chromatogram. The E site is indicated with a black arrowhead. The graph shows the editing ratio, calculated as (height of the C peak)/(height of C peak + height of T peak), as a function of the reaction duration. (C) Correlation between editing ratios obtained from direct sequencing and those calculated with the cleavage assay. The calculated editing ratio was estimated as follows: ER = ERini/[(1 − Urini) × CR], where ER is the editing ratio; ERini is the initial editing ratio; URini is the unediting ratio; and CR is the cleavage ratio. The graph plots the correlation, where the x-axis is the calculated editing ratio from the cleavage assay, and the y-axis is the experimental editing ratio obtained from direct sequencing. The best-fit trendline is shown; the y-intercept is 0.00; the slope is 0.92; and the Pearson R value is 1.00.




