


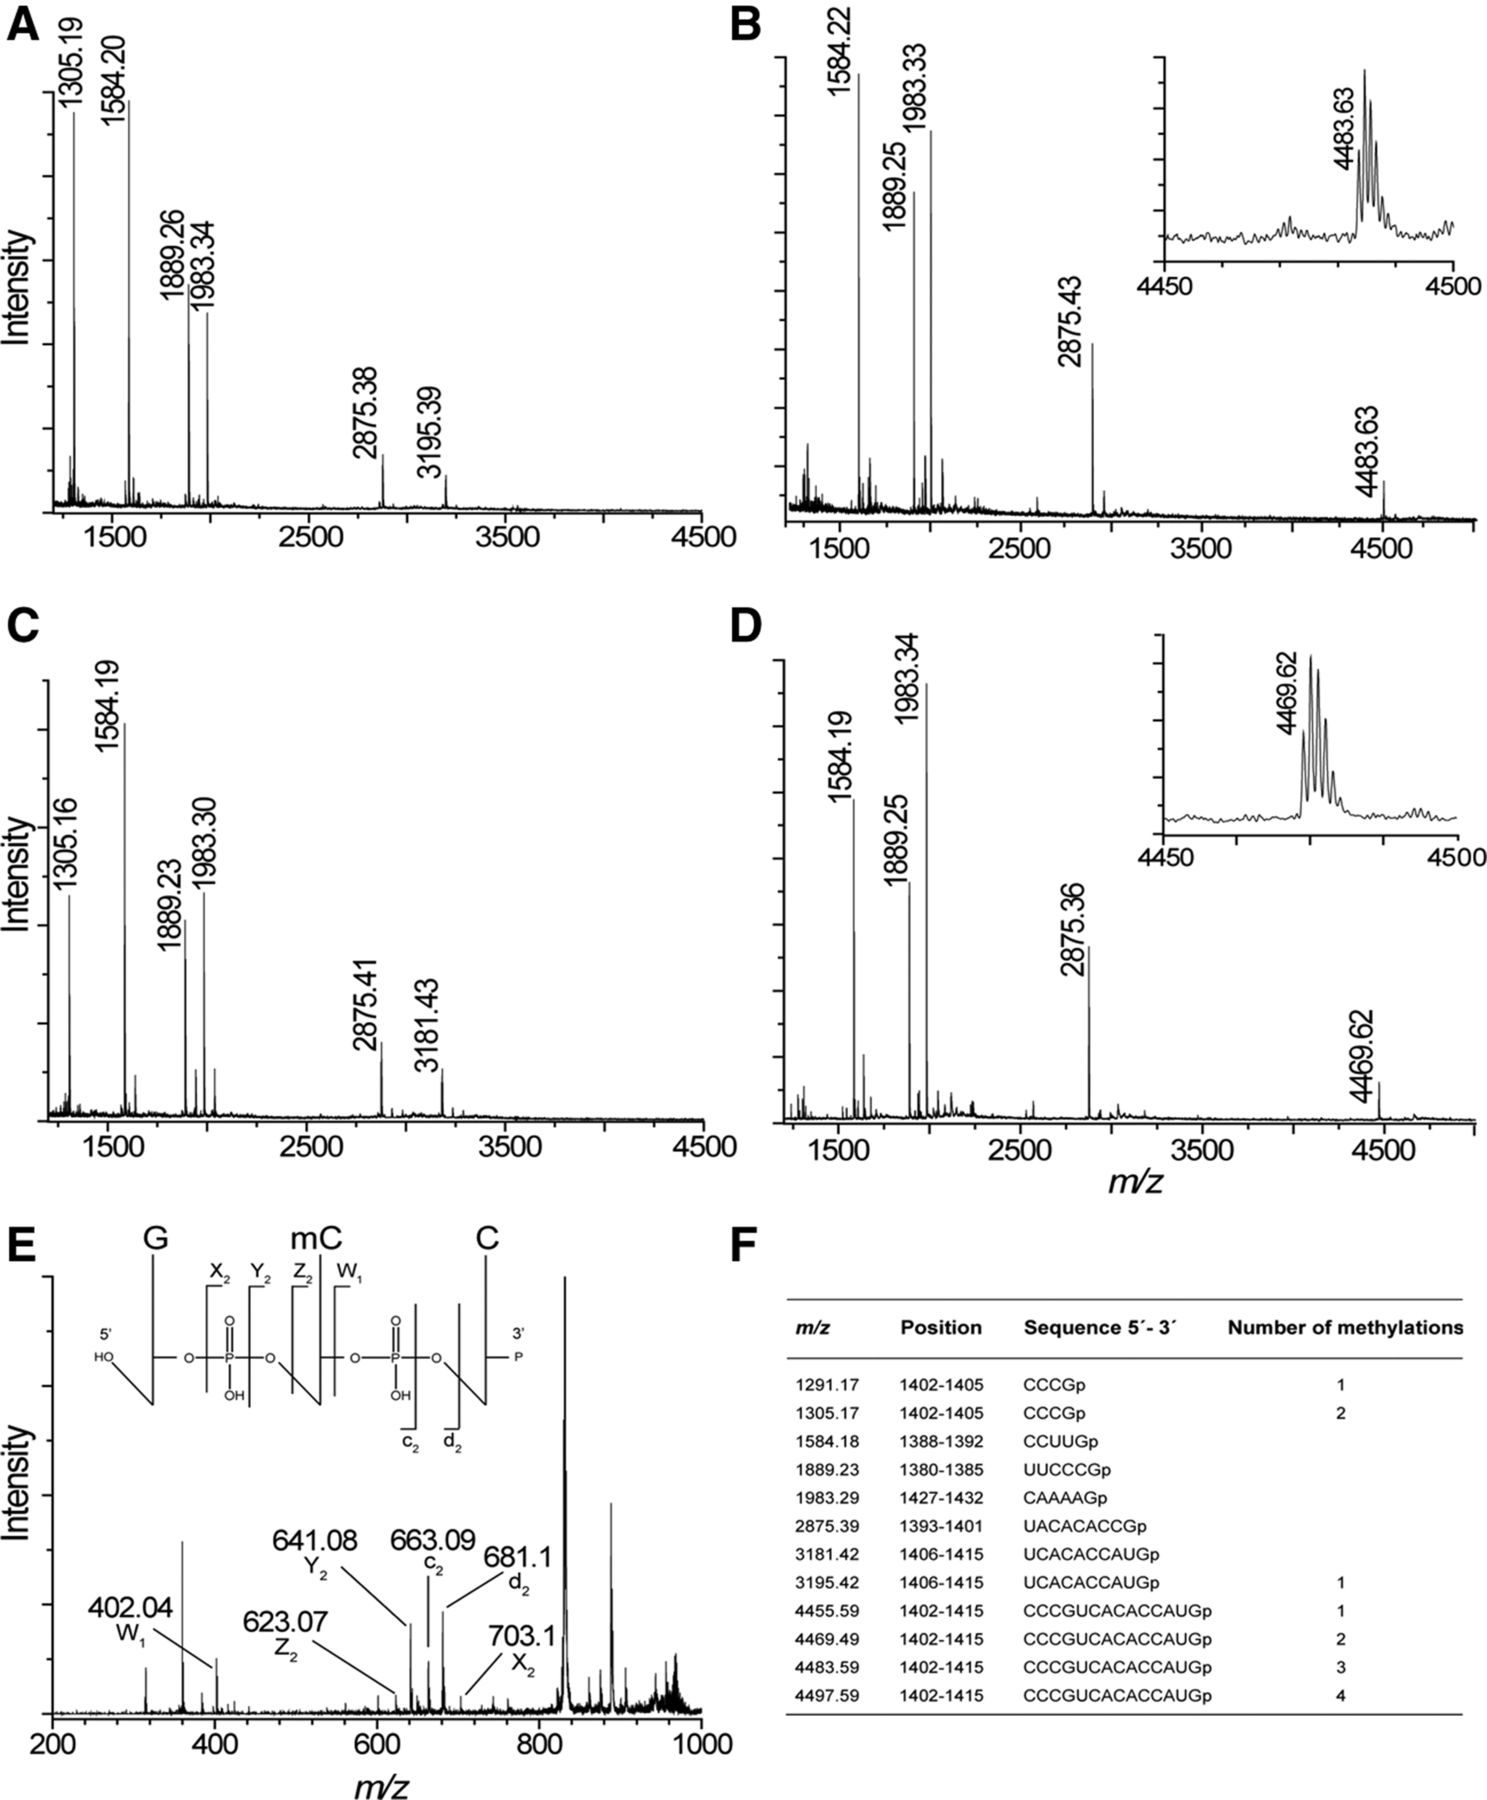
MALDI MS analysis of ArmA methylation in 16S rRNA fragment C1378–G1432. (A) Spectrum of RNase T1 rRNA from E. coli MM294/pGB2. The empirical m/z values are given above the peaks and match the theoretical masses (see below) to within 0.1 Da. (B) Spectrum from E. coli MM294/pGB2ΩarmA. Fragments at m/z 1305 and 3195 are missing and fused in the longer fragment at m/z 4483. (Inset) Enlargement of the spectrum around m/z 4480. Spectrum of RNase T1 rRNA from (C) E. coli MM294▵rsmF/pGB2 and (D) E. coli MM294▵rsmF/pGB2ΩarmA. Fragments at m/z 1305 and 3181 are missing and are fused in the longer fragment at m/z 4469. (Inset) Enlargement of the spectrum around m/z 4460. (E) MALDI tandem MS of RNase A rRNA from E. coli MM294/pGB2ΩarmA. The fragment at m/z 986 corresponding to GCCp fragment (positions 1401–1403) was selected and subjected to further fragmentation. Peaks corresponding to mCCp (Z2), Cp (W1), and GmC (c2) are indicated. These ions confirm that C1402 was monomethylated. (F) Theoretical masses of the monoisotopic E. coli RNase T1 fragments with 3′-linear phosphate (p). Only fragments that are tetranucleotides and larger are shown.




