


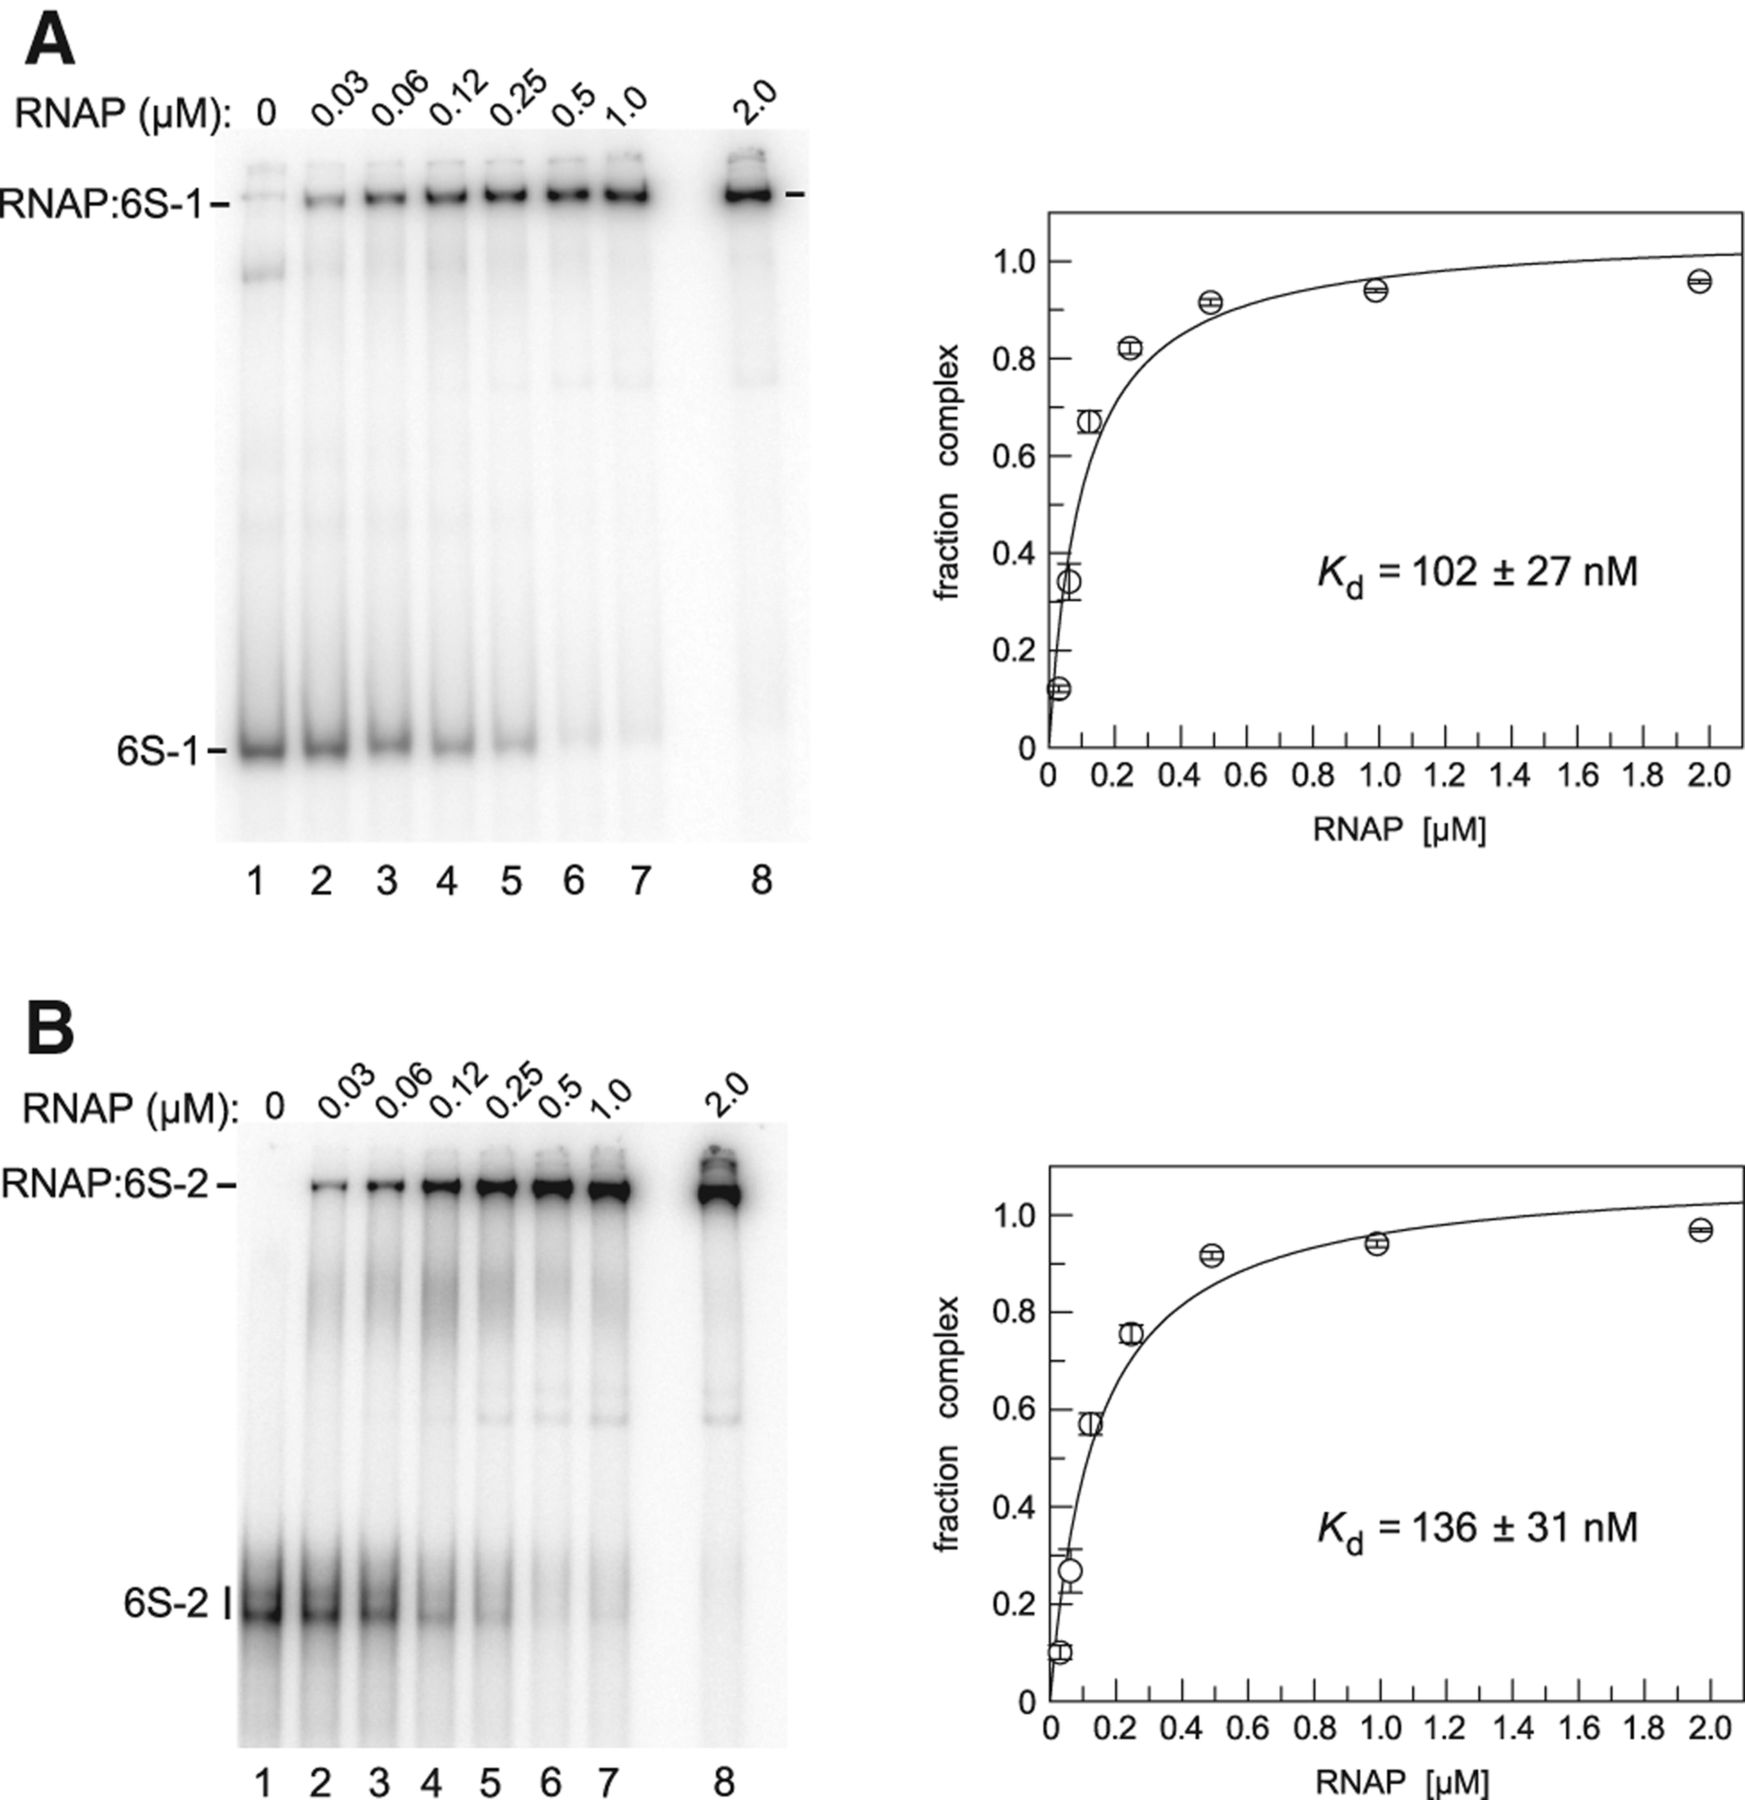
Complex formation of trace amounts of radiolabeled (A) 6S-1 RNA or (B) 6S-2 RNA as a function of increasing amounts of σA-RNAP holoenzyme (f.c. indicated above each lane). Lane 1 in each is a control in the absence of σA-RNAP. Kd values indicated in the graphs on the right were obtained by fitting the mean values from six individual experiments each to a binding equation for a single ligand binding site (program Grafit version 3.04, Erithacus Software). Error bars are standard deviations of the mean. For more details, see Materials and Methods. In the gel image of panel A, the RNAP:6S-1 RNA complex (lanes 2–8) indicated by dashes migrates faster than the neighboring band in lane 1, which likely represents a 6S-1 RNA oligomer.




