


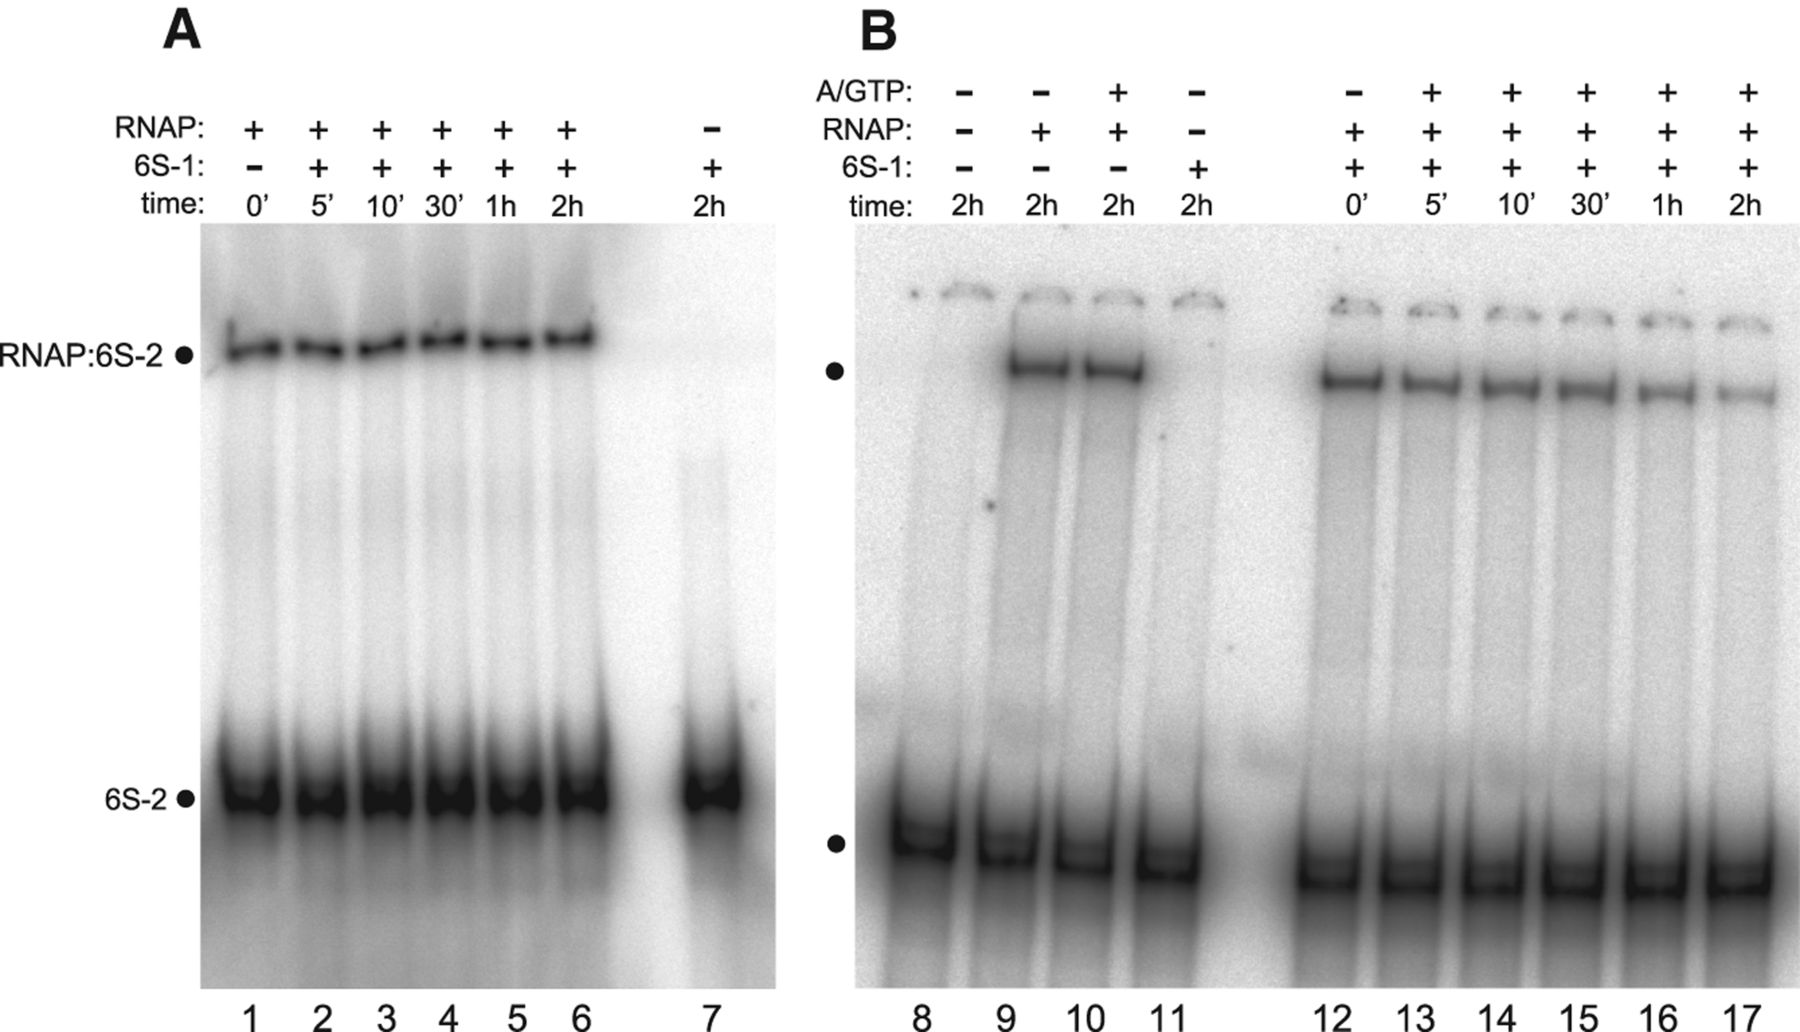
(A) Analysis of 6S-2 RNA displacement from σA-RNAP by 6S-1 RNA. 0.25 µM σA-RNAP was incubated with a fivefold excess of radiolabeled 6S-2 RNA (1.25 µM) in 1× activity buffer for 15 min at 37°C to allow complex formation. Then, 12.5 µM unlabeled 6S-1 RNA were added, and samples were incubated for 5, 10, 30, 60, or 120 min at 37°C before loading onto a 7.5% native PAA. Lane 1: ddH2O instead of 6S-1 RNA was added; lane 7: as lane 6, but without RNAP (for details, see Materials and Methods). The same result was obtained in two additional independent experiments (data not shown). Also, quantification of phosphorimage signals for free 6S-2 RNA and the complex with RNAP did not reveal any decrease in the proportion of 6S-2 RNA:RNAP complexes over time. (B) Experiment as in panel A, but incubation with ATP and GTP (each 200 µM). Lane 8: 6S-2 RNA, no RNAP, no 6S-1 RNA, no NTPs; lane 9: 6S-2 RNA, RNAP, no 6S-1 RNA, no NTPs; lane 10: 6S-2 RNA, RNAP, no 6S-1 RNA, ATP and GTP; lane 11: 6S-2 RNA, no RNAP, 6S-1 RNA, no NTPs; lanes 12–17: as lanes 2–6, but after addition of 6S-1 RNA, samples were incubated for 15 min at 37°C, followed by addition of ATP/GTP (ddH2O instead in lane 12) and incubation for the time period indicated above each lane.




