


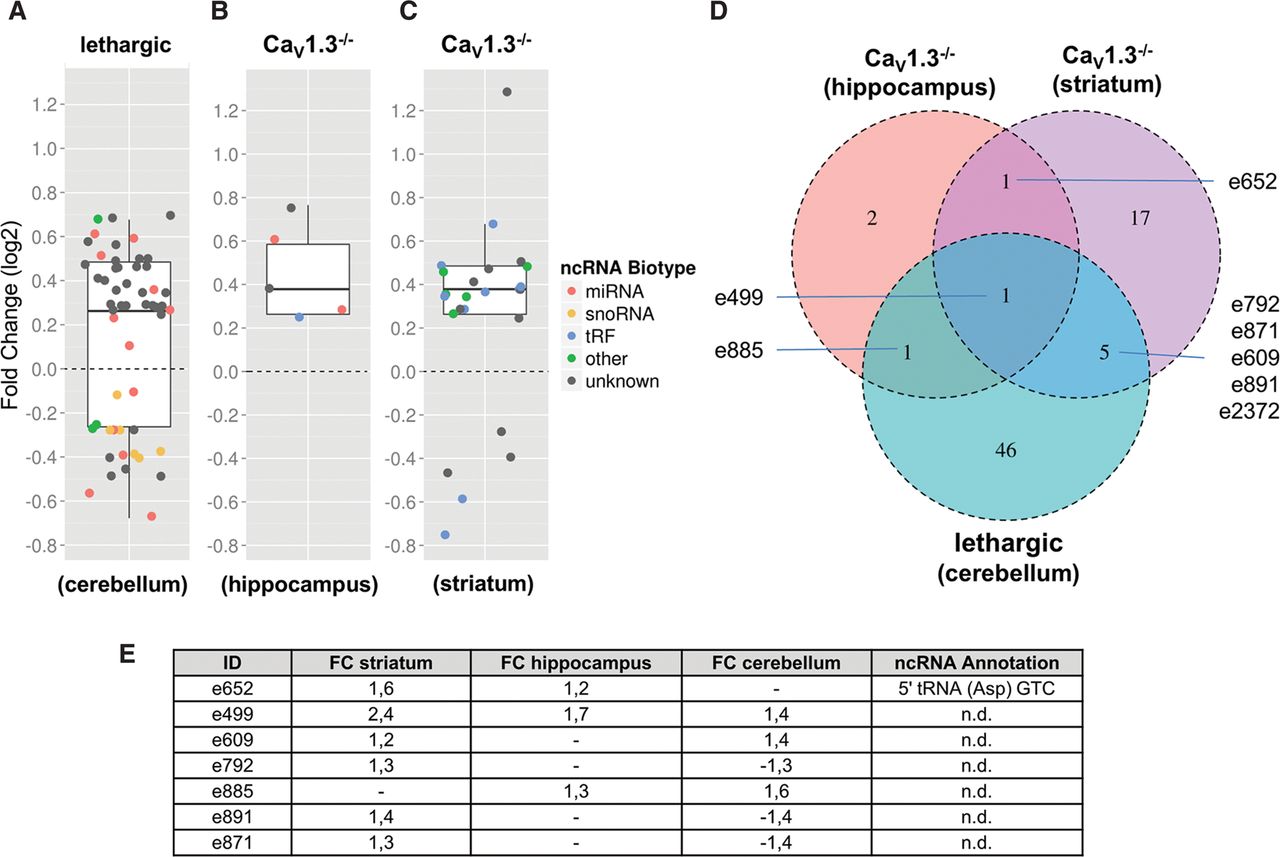
Differential expression analysis of ncRNAs from selected brain regions of mouse models for voltage-gated calcium channel activity compared with wild type. (A) Cacnb4 mutant mouse: cerebellum. (B) CaV1.3−/−: hippocampus. (C) CaV1.3−/−: striatum. Box plots represent fold changes of ncRNAs (colored data points), which showed significant changes in expression relative to wild-type controls in microarray experiments. Fold changes are illustrated in log2 scale. Whiskers extend to ±1.5-fold of the interquartile range (IQR). Biotypes are designated by color code: miRNAs (red), snoRNA (orange), tRF (blue), other biotypes (green), and unknown biotype (gray). (D) Venn diagram illustrating the overlap of differentially expressed candidates between the models analyzed. (E) Fold change and annotation of ncRNA candidates highlighted in D.




