


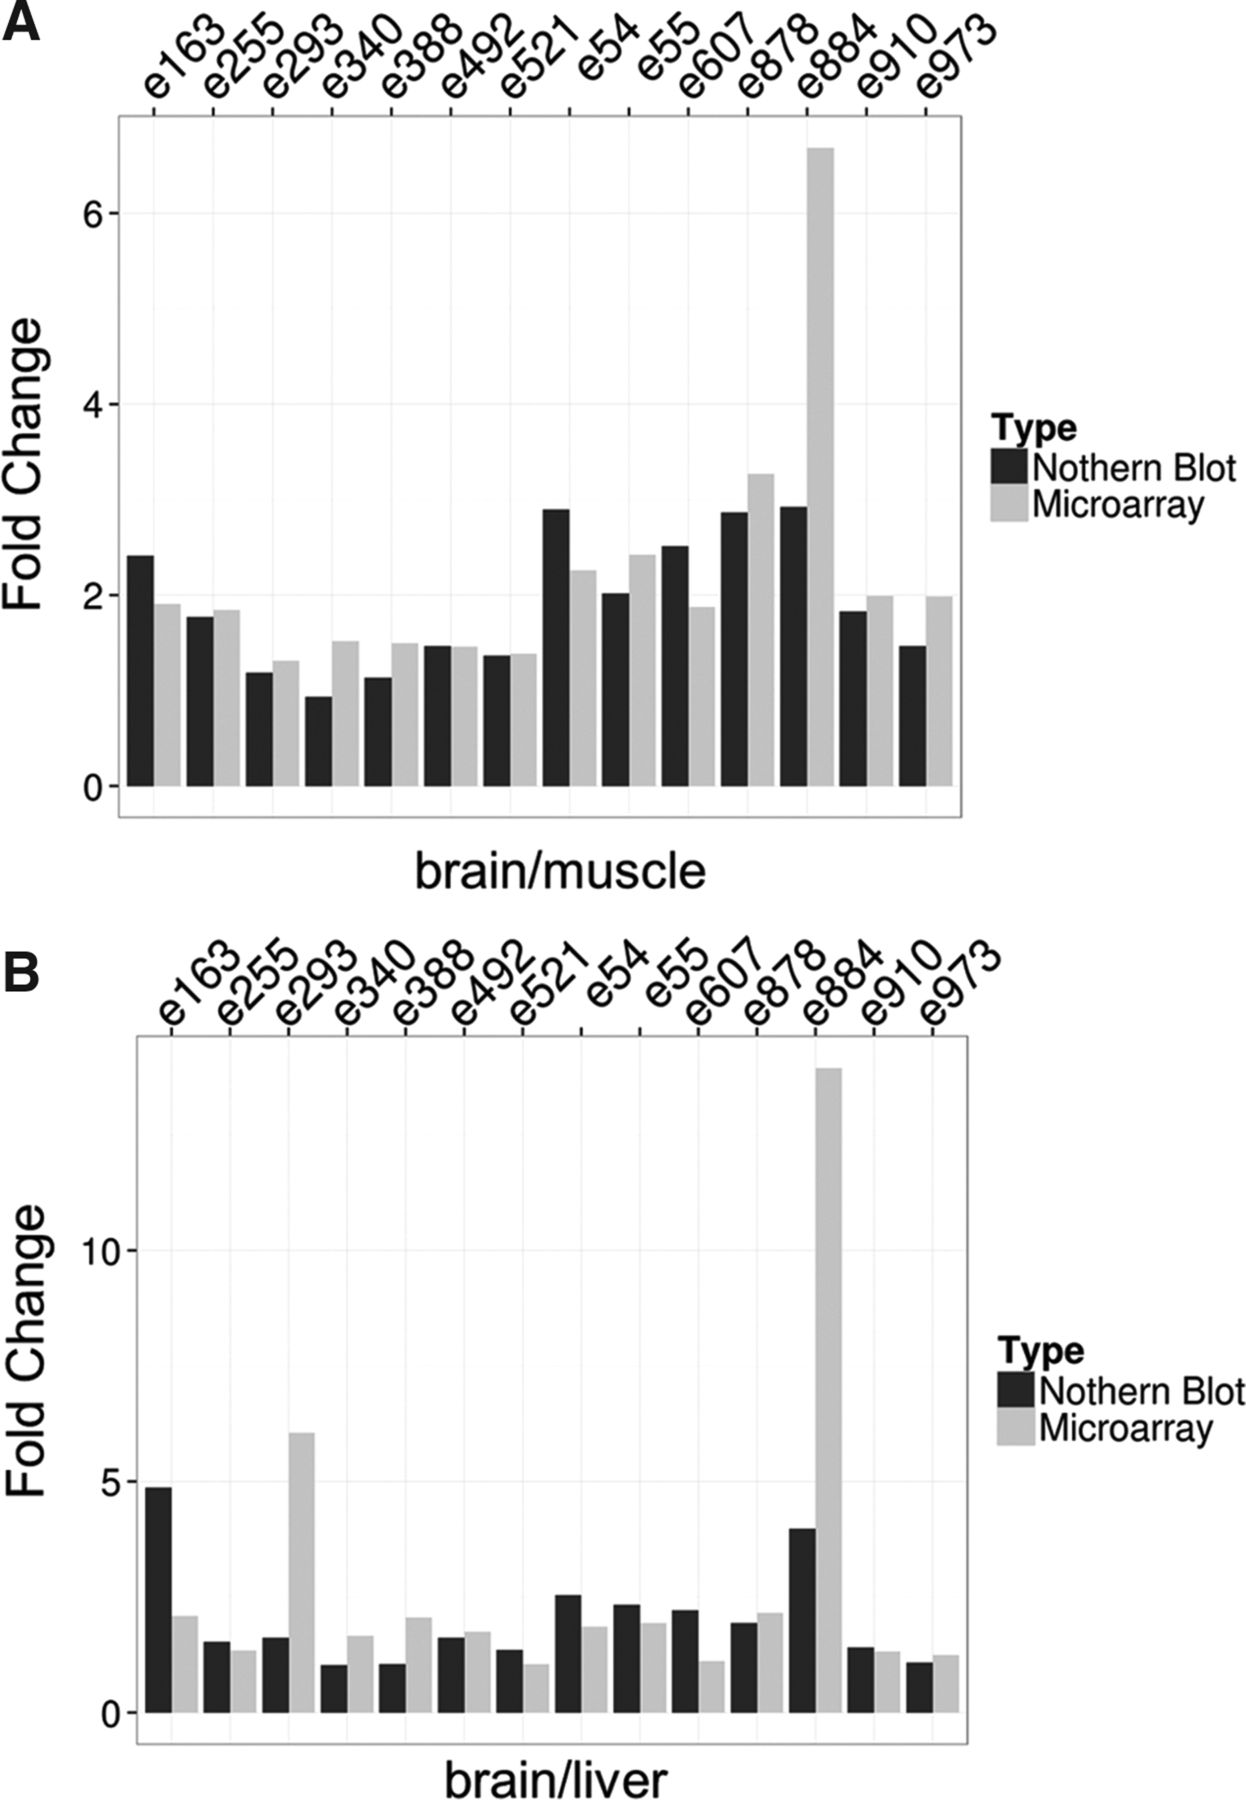
FIGURE 3.
Comparison of expression analysis between Northern blot (black bars) and microarray analysis (gray bars) of 14 randomly chosen ncRNAs. (A) Expression changes of ncRNAs between brain and muscle tissues. (B) Expression changes of ncRNAs between brain and liver tissues. Candidate IDs are indicated on top. Details are listed in Supplemental Table 2. Fold changes from Northern blot analysis were quantified by using ImageQuant 8.1 (GE Healthcare).




