


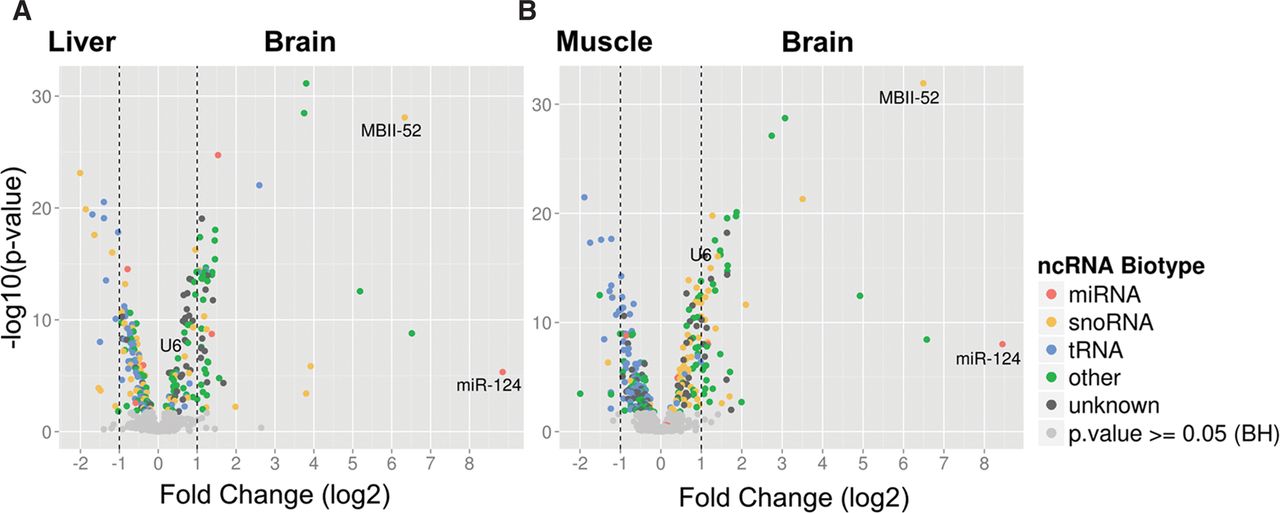
FIGURE 2.
Differential expression analysis of ncRNAs between brain, liver, and muscle tissues, respectively. Volcano plots illustrate ncRNA levels of (A) liver and (B) muscle compared with brain tissue. ncRNAs with significant changes in expression are indicated by colored dots. Biotypes are designated by color code: miRNAs (red), snoRNAs (orange), tRNA (blue), other (green), and unknown biotype (gray). Vertical dashed lines indicate a twofold change in expression.




