


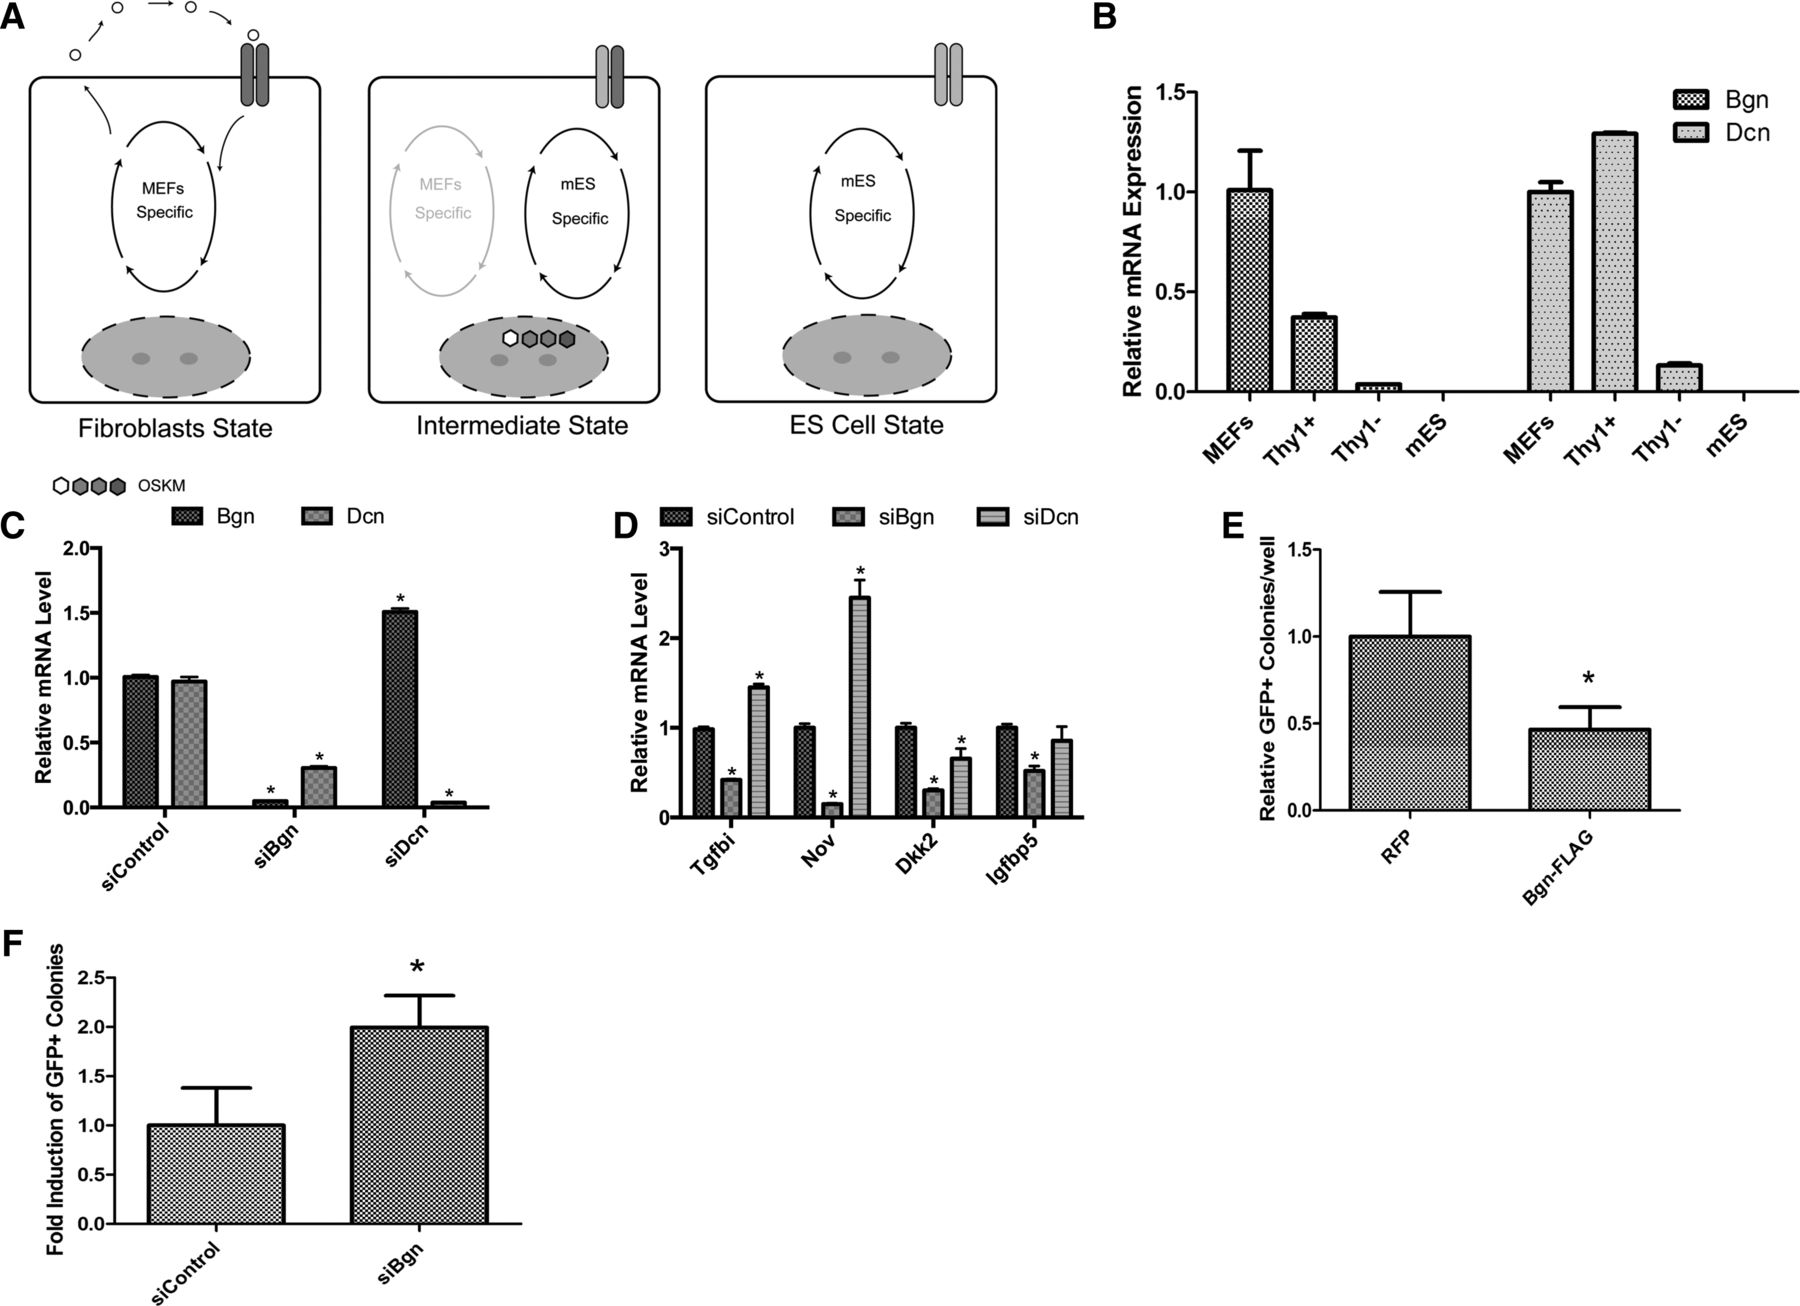
Target gene regulation by Wisp1 through biglycan. (A) Proposed model for Wisp1 dual role during reprogramming. In wild-type MEFs (fibroblast state), normal proliferation and function of the cells are dependent on a MEF-specific regulation network, where Wisp1 is one of the most important ECM components and regulates the expression of several other ECM genes. In 4F-transduced MEFs (intermediate state), two systems coexist; one from the MEF-specific network and the other from the four transcription factors. ECM signals from the MEF-specific network interfere with the cells becoming fully reprogrammed. In fully reprogrammed cells (ES cell state), ECM receptors are no longer expressed, and the cells are thus resistant to interfering signals from surrounding MEFs. (B) Biglycan and decorin are specifically expressed in MEFs. Expression of biglycan and decorin was analyzed by RT-qPCR in sorted cells. (C) Biglycan and decorin are efficiently knocked down by siRNAs. MEFs were transfected with siRNAs for 2 d and total RNAs were harvested for RT-qPCR analysis. (D) Knockdown of biglycan decreases expression of Wisp1-regulated ECM genes. Expression of Wisp1-regulated ECM genes was analyzed in MEFs subjected to knockdown of biglycan or decorin. Error bars represent two independent experiments with duplicate wells. (E) Overexpression of biglycan inhibits reprogramming. Flag-tagged biglycan was cloned into pMX vector and transduced into MEFs together with 4F. GFP+ colonies were quantified at Days 11–13. Error bar represents two independent experiments with triplicate wells. (*) P < 0.05. (F) Knockdown of biglycan enhances reprogramming. Biglycan siRNAs were transfected into MEFs at Day 5 post-4F transduction. GFP+ colonies were quantified at Days 11–13. Error bar represents two independent experiments with triplicate wells. RT-qPCR data were analyzed using the Wilcoxon rank-sum test. (*) P < 0.05.




