


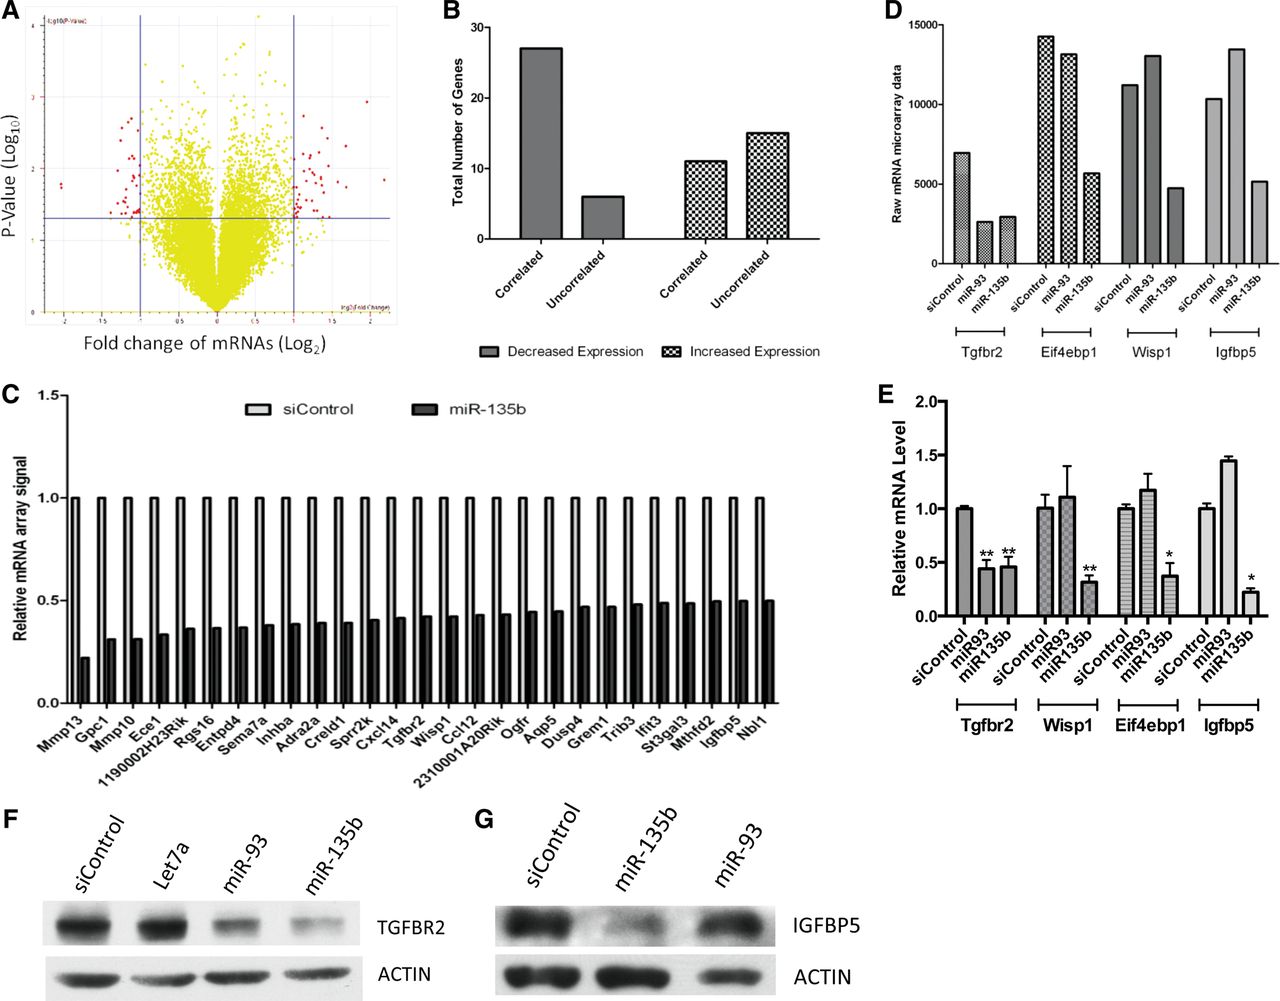
Genome-wide identification of potential miR-135b target genes. (A) Volcano maps from miR-135b-transfected MEFs. MEFs were transfected with siControl and miR-135b for 2 d and analyzed by mRNA expression array. Hits (red dots) were gated for at least twofold expression change and P < 0.05. (B) miR-135b-repressed genes are enriched for genes suppressed in ES/iPS cells. miR-135b-regulated genes were separated into two groups (induced or repressed) and then compared with existing iPS/ES/MEF expression profiles. “Correlated genes” indicate that genes changed upon miR-135b transfection showed similar changes from MEFs to iPS/mES cells. “Uncorrelated genes” indicate a group of genes that were changed upon miR-135b transfection but had a different (reversed) change in expression pattern from MEFs to iPS/mES cells. (C) List of correlated miR-135b-repressed genes. (D) Representative miR-135b-regulated genes from microarray. (E) Expression of miR-135b-regulated genes was confirmed by RT-qPCR. MEFs were transfected with microRNA mimics for 2 d before harvesting for RT-qPCR analysis. Error bar represents two independent experiments with duplicate samples. (F) TGFBR2 protein expression is suppressed by miR-93 and miR-135b. Total proteins were harvested for Western blotting analysis at Day 2 post-transfection with miR mimic. (G) IGFBP5 protein expression is suppressed by miR-135b. A miR-93-transfected sample was included as a negative control. RT-qPCR data was analyzed using the Wilcoxon rank-sum test. (*) P < 0.05; (**) P < 0.01.




