


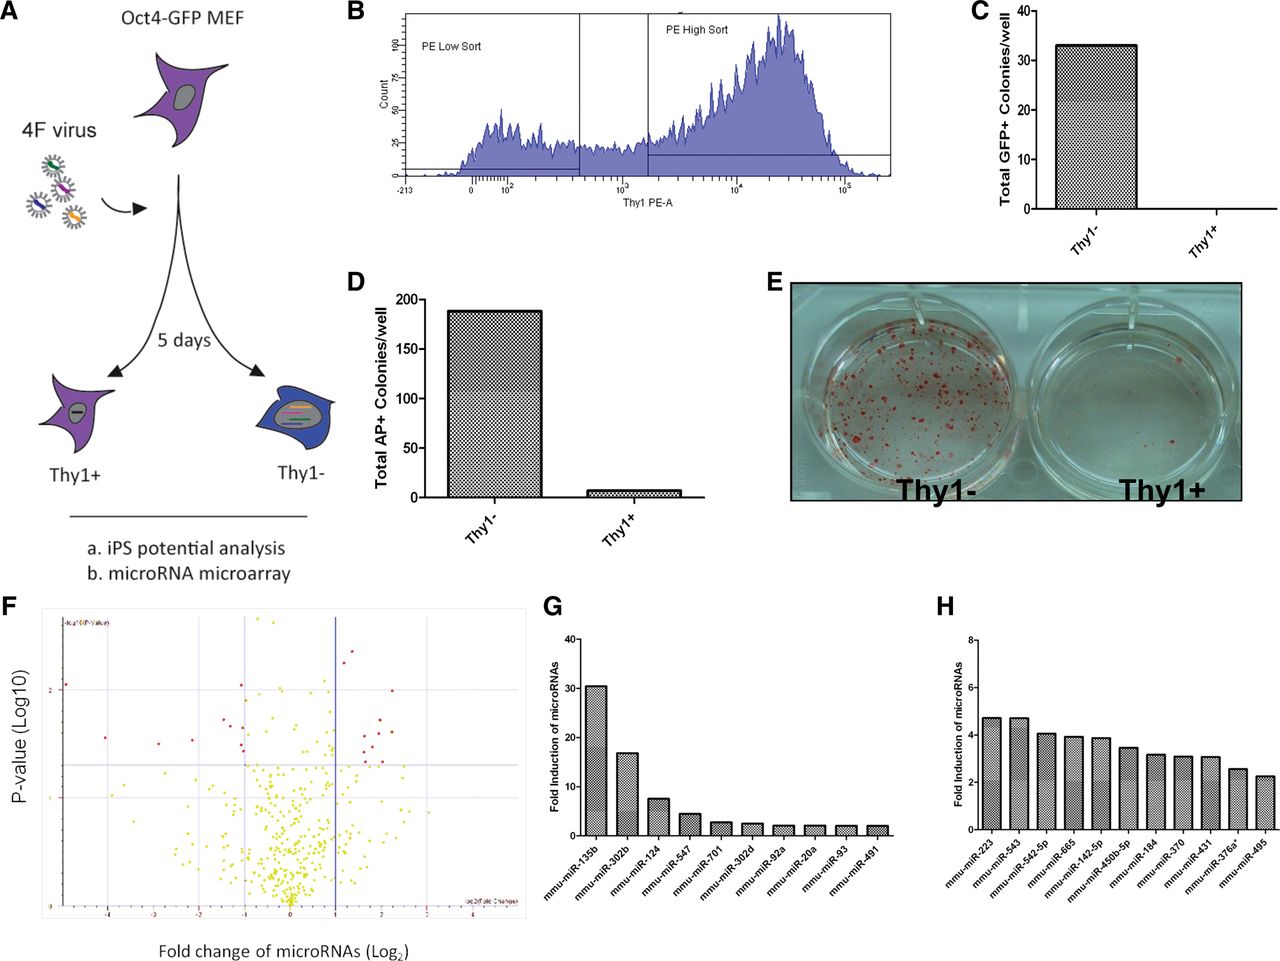
Identification of highly regulated microRNAs during the early reprogramming stage. (A) Scheme of experimental design. MEFs were infected with 4F virus for 5 d, and sorted based on expression of the Thy1 surface antigen. Both Thy1− and Thy1+ cells were collected for microRNA expression profile analysis. (B) Representative gating for Day 5 4F-infected MEF sorting. PE-conjugated Thy1 antibody was used to detect Thy1− and Thy1+ populations. (C) iPSCs were enriched in the Thy1− population of 4F-infected MEFs at Day 5. Equal numbers of cells (10,000 cells) sorted from 4F-infected MEFs were replated into feeder plates and cultured for 14 d, then GFP+ colonies were counted. (D) AP staining confirmed that iPSCs generated in (C) were enriched in the Thy1− population. Cells were harvested for AP staining at Day 14 post-infection. (E) Representative image of AP+ colonies from replated Thy1− and Thy1+ cells. (F) Induced or repressed microRNAs were identified in Thy1− cells. Both Thy1− and Thy1+ cells were harvested for microRNA expression profiling. Data from the Thy1– population were compared with the original MEFs and microRNAs showing a twofold change and P < 0.05 were identified using a volcano map. Hits are labeled as red dots. (G) Set of significantly induced microRNAs. MicroRNAs induced by at least twofold are shown. (H) Set of significantly repressed microRNAs. MicroRNAs repressed by at least twofold are shown.




