


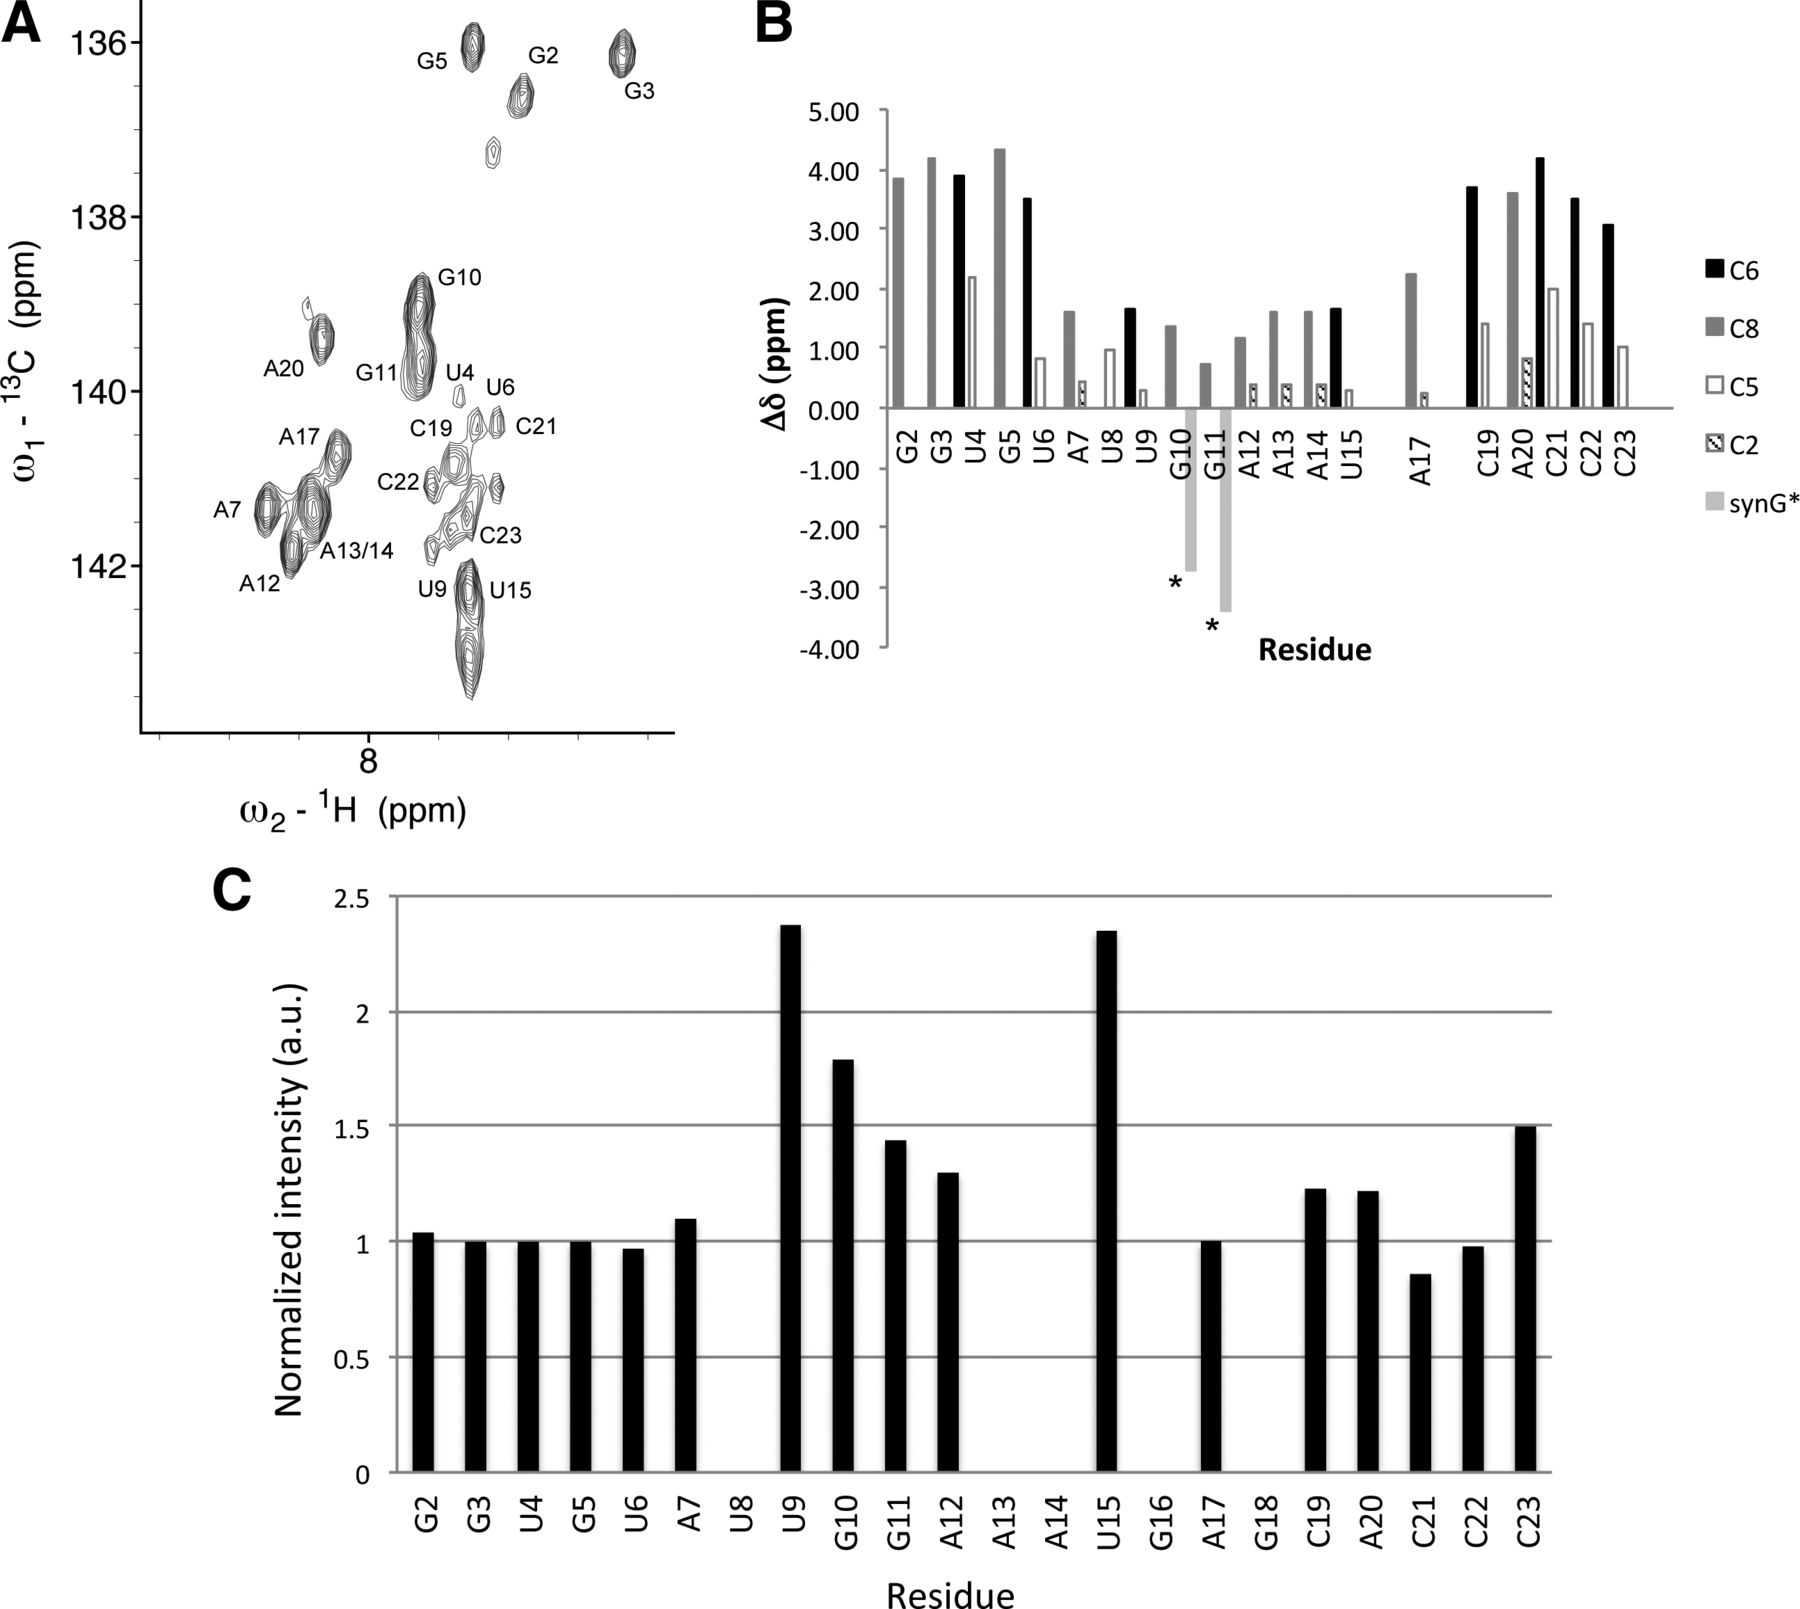
(A) Section of a 13C-HSQC spectrum of the ID3 stem–loop showing C6/8-H6/8 correlations. In this spectrum, pyrimidine cross-peaks appear as doublets as a result of the unrefocused 1JC5-C6 scalar coupling, with an unmarked downfield partner in the 13C dimension. The downfield-shifted chemical shifts of C8 resonances for the residues of the loop of ID3 are consistent with increased flexibility. Concentration of RNA in the sample was ∼0.3 mM; the spectrum acquired with 64 scans and 256 increments. (B) Plot of chemical shift values for aromatic carbon resonances were compared to analogous positions of nucleotide monophosphates (NMPs). The chemical shift difference is defined as δ (NMP)-δ (ID3) to obtain positive values. Resonances in the loop of ID3 display similar chemical shift values to those of NMPs, suggesting a disordered loop. Bars marked by syn G* identify residues that displayed a large downfield chemical shift relative to the value for C8 resonances of the residues in the stem. The large negative value for δ (Gstem) − δ (Gloop) is consistent with a syn glycosidic angle of those residues. (C) Plot of normalized intensity of C6/8-H6/8 cross-peaks from a nonconstant time 13C-HSQC spectrum shows relative flexibility of residues. The intensity of aromatic cross-peaks was compared with the intensity of the C8 resonance of the G3 residue in the stem (value set at 1.0). Increased intensity is associated with higher pico- to nanosecond fluctuations than in the residues of the ID3 stem.




