


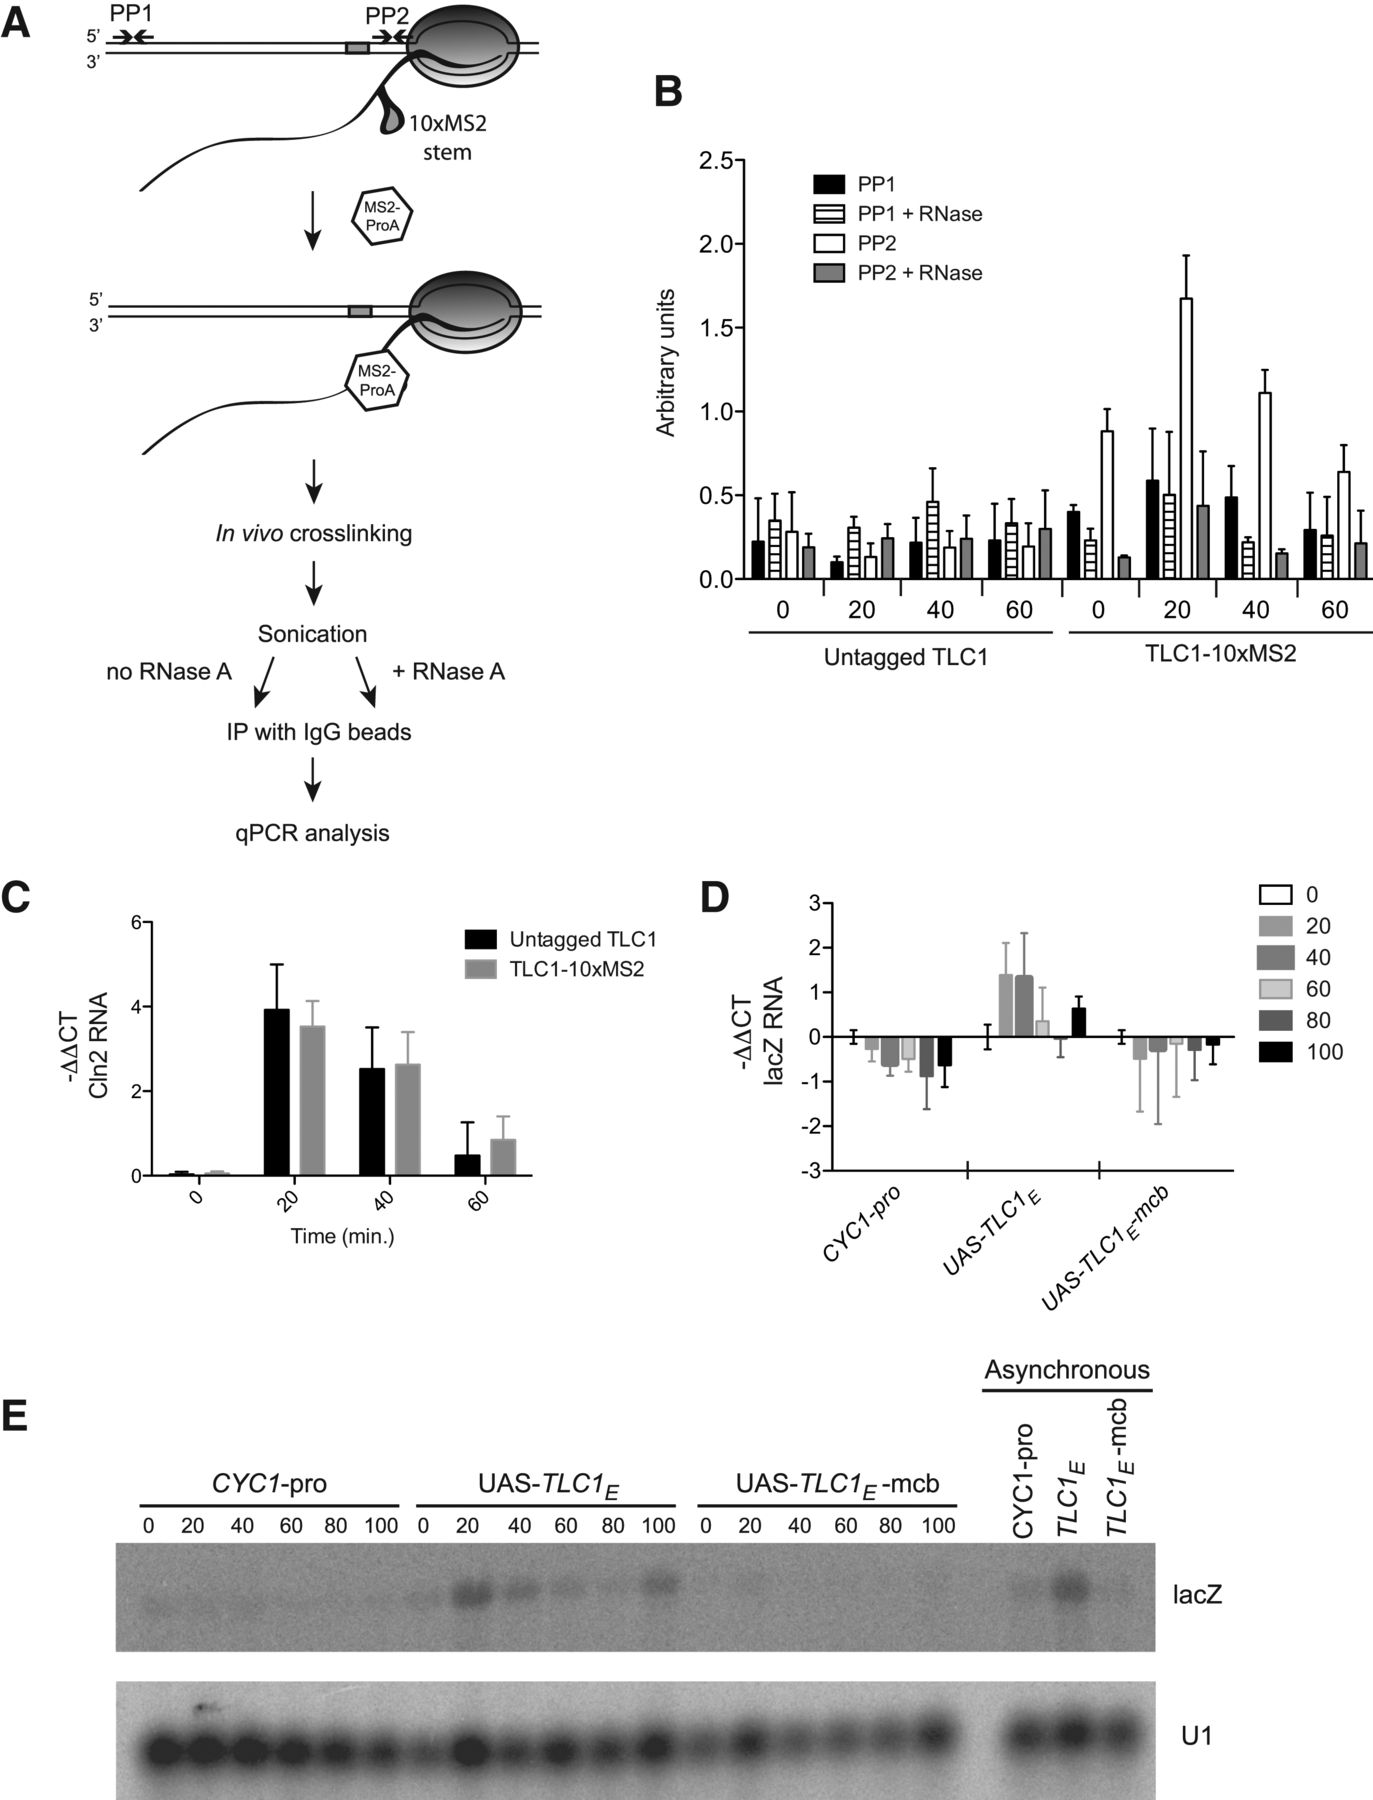
The E region containing MCB sites confers cell cycle regulation to TLC1 transcription. (A) Scheme of the RBP-ChIP experiment. Representation of the MS2-tagged (gray box) TLC1 locus transcribed by RNA polymerase II. Following transcription, the MS2 stems are folded, and MS2-ProA proteins are bound to the stems. Performing a chromatin immunoprecipitation (ChIP) with IgG on cells that are transcribing TLC1 will coimmunoprecipitate DNA sequences close to the 3′-end sequence of TLC1. This immunoprecipitation is expected to be dependent on the RNA, treatment with RNase A should abolish immunoprecipitation and is used as control. The primer pair 1 (PP1) overlaps the promoter and the beginning of the gene, whereas the primer pair 2 (PP2) is just downstream from the 10xMS2 tag. (B) qPCR analysis of RBP-ChIP experiments on SBY40 (untagged TLC1) and SBY44 (TLC1-10xMS2) cells at different time points after release from the G1 arrest (t = 0). The amount of coprecipitating DNA was measured by qPCR using primer pair 1 (PP1) and primer pair 2 (PP2) located at 1.1 kb and 60 nt from the MS2 tag, respectively. Each sample was also treated with RNase A to determine the dependence of the immunoprecipitation on the RNA. Average values of three independent biological replicates (two for RNase-treated) normalized against input DNA with SD are shown. (C) qRT-PCR analysis of Cln2 RNA levels at indicated time points for the same experiments as shown in B. CLN2 is a well-known SBF cell cycle–regulated gene and thus serves as a positive control for cell synchronization and activation of the transcription. Average values of three independent biological replicates normalized against Act1 with standard deviation are shown as fold change over t = 0 (G1). (D) qRT-PCR analysis of lacZ RNA levels at indicated time points. MLY30 cells carrying SLP162 (CYC1 pro-lacZ), SLP164 (CYC1 UASTLC1Epro-lacZ), or SLP185 (CYC1 UASTLC1E-mcbpro-lacZ) were arrested in G1. Synchronized cultures were released, and samples were taken every 20 min. Average values of three independent biological replicates normalized against Act1 mRNA with SD are shown as fold change over t = 0 (G1). (E) Northern blot analysis of the same samples as in D.




