


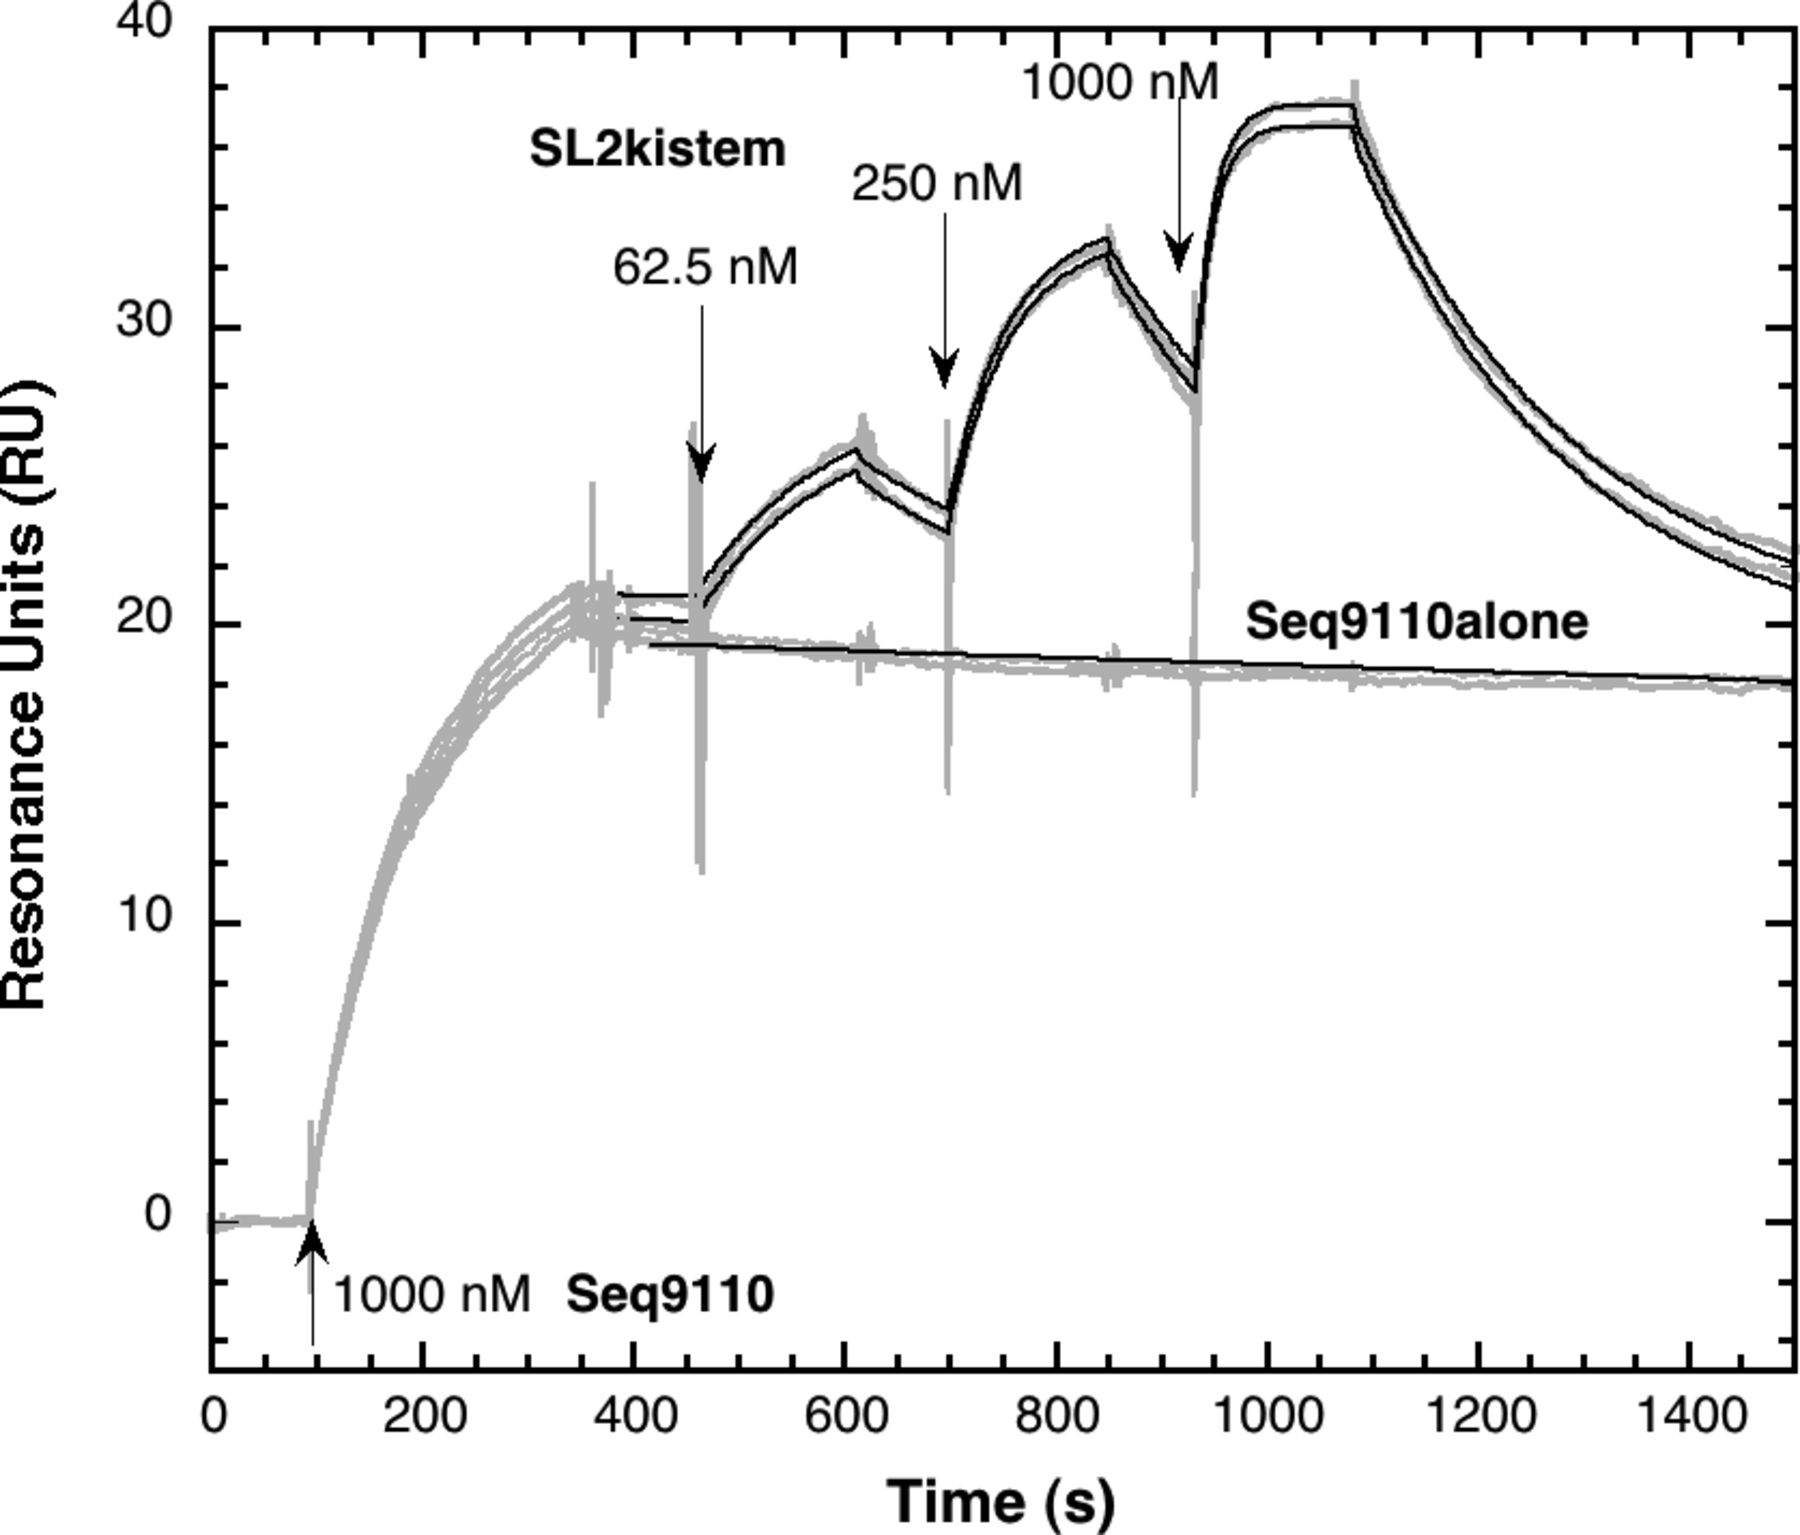
Kinetic analysis by the SCKODS method of SL2kistem hairpin and Seq9110 binding to 5BSL3.2. The sensor chip was prepared as described in Figure 2 and in Materials and Methods. Seq9110 was first injected over the 5BSL3.2-coated surface at 1 µM (first arrow from the left). During the dissociation phase of the formed Seq9110-5BSL3.2 complex, SL2kistem was injected sequentially in the order of increasing concentrations, 62.5 nM (second arrow), 250 nM (third arrow), and 1000 nM (fourth arrow). Experiments were performed with injections of Seq9110 only (referred to as Seq9110 alone). The regeneration of the surface was achieved with a 2-min pulse of a mixture of 40% formamide, 3.6 M urea, and 30 mM EDTA prepared in milli-Q water. The gray curves represent the experimental data (two overlaid sensorgrams for SL2kistem and Seq9110 alone). The black line for Seq9110 alone represents the fit of the dissociation phase according to Equation (2). The black lines for SL2kistem represent the fit to a Langmuir 1:1 model of interaction according to Equations (1) and (2) by the SCKODS method.




