


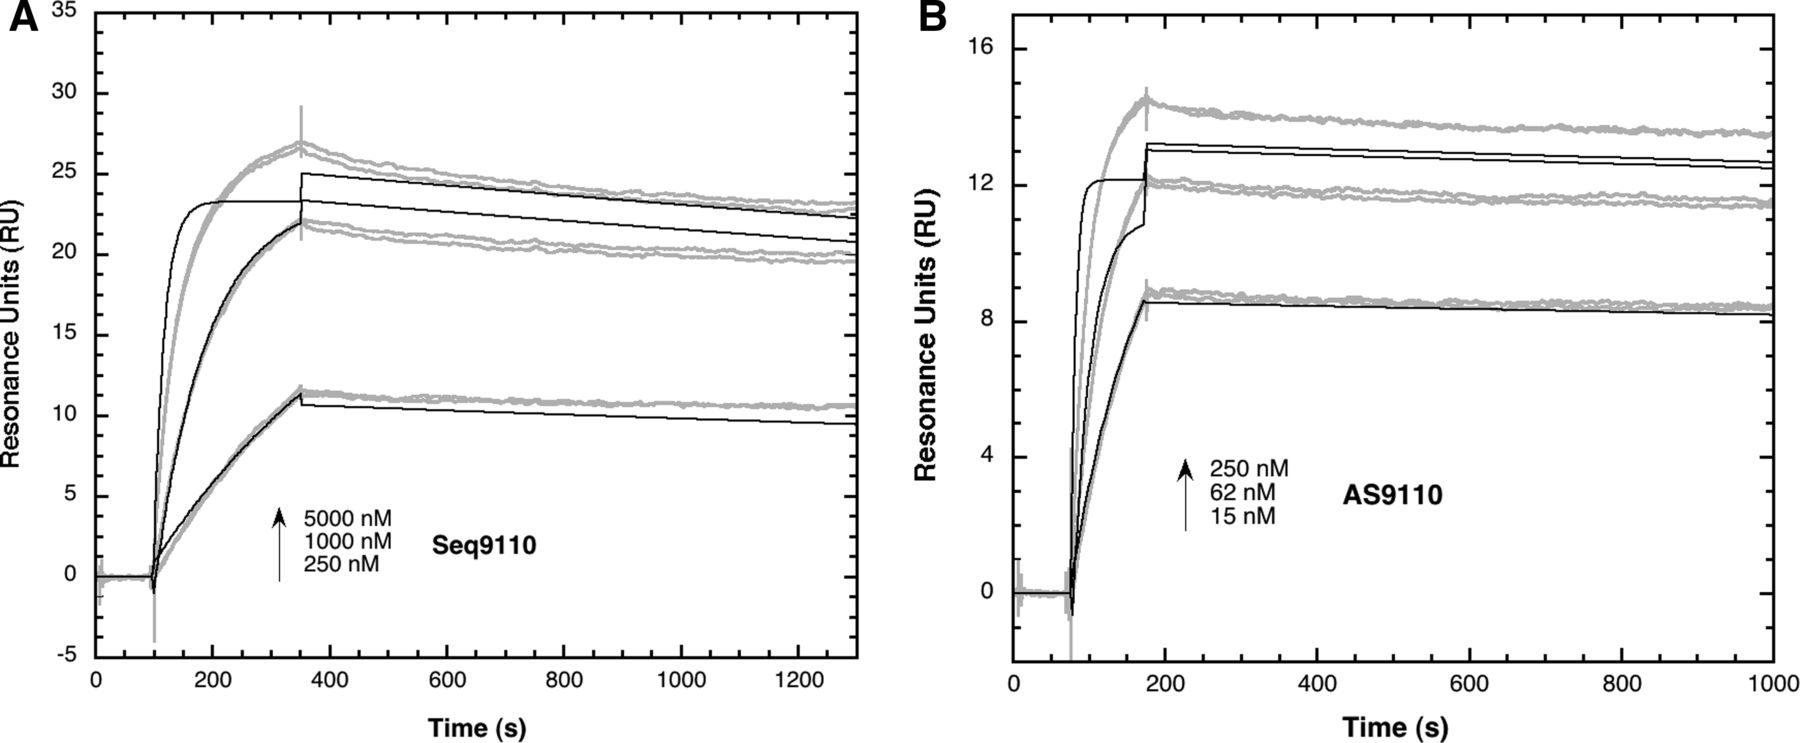
FIGURE 4.
Kinetic analysis of Seq9110 and AS9110 binding to 5BSL3.2. The sensor chip was prepared as described in Figure 2 and in the Materials and Methods. RNA samples were injected over the functionalized surface in duplicate. Two overlaid sensorgrams (gray curves) are shown for each injected concentration. The regeneration of the surface was achieved with a 2-min pulse of a mixture of 40% formamide, 3.6 M urea, and 30 mM EDTA prepared in milli-Q water. The black lines represent the fit of one set of sensorgrams by global fitting analysis to a Langmuir 1:1 model. (A) Injection of Seq9110. (B) Injection of AS9110.




