


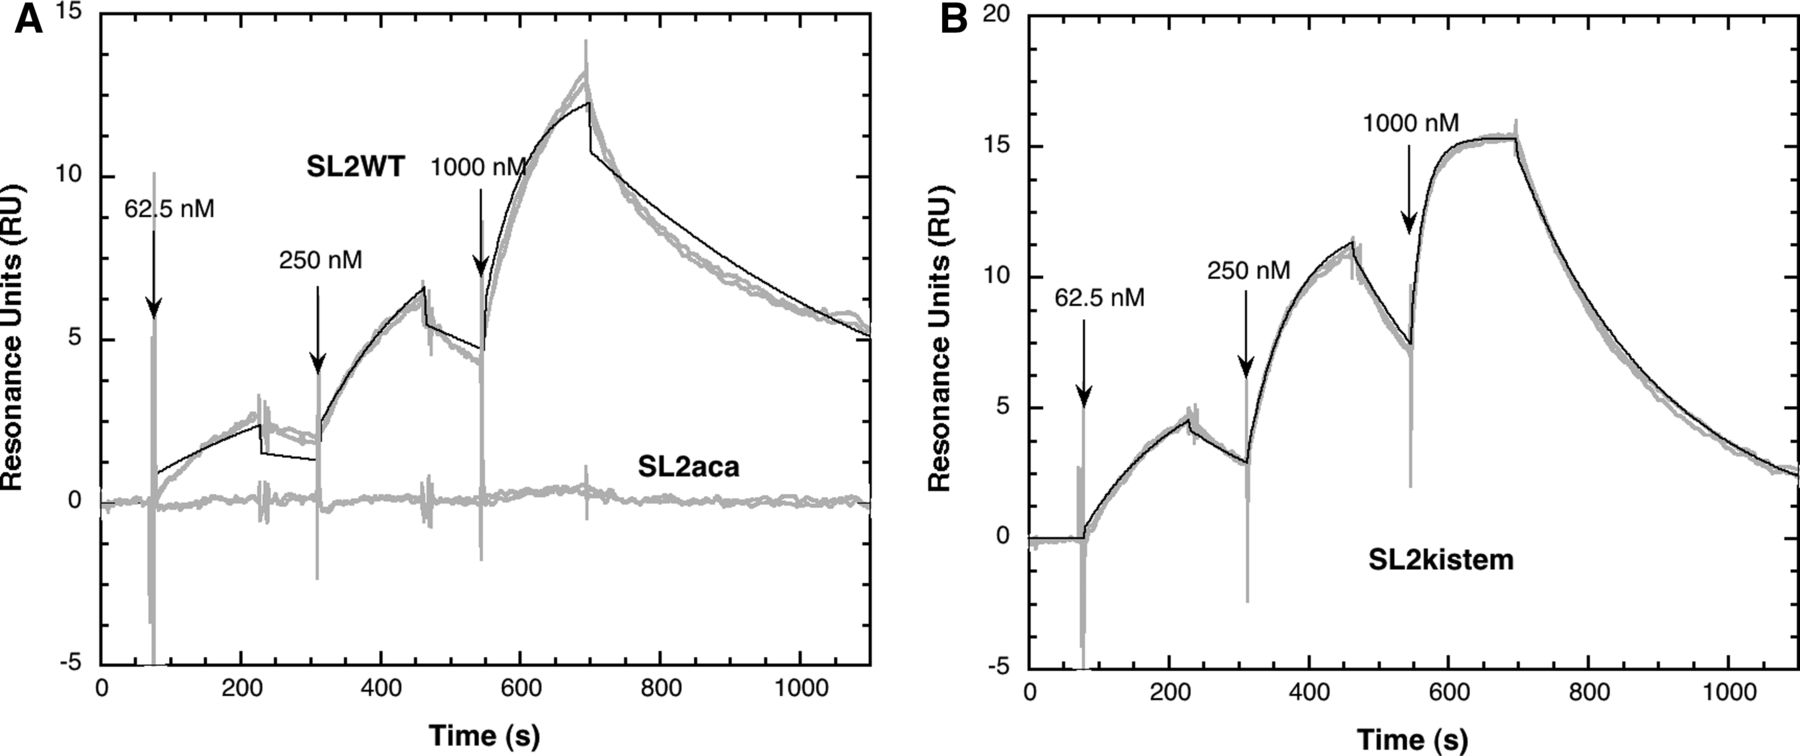
Kinetic analysis by the SCK method of SL2 hairpins binding to 5BSL3.2. The experiments were performed at 10°C on a SAHC200m sensor chip, at a flow rate of 50 µL/min. Thirty to 70 RU of biotinylated 5BSL3.2 were immobilized on the sensor chip. The samples were injected sequentially in the order of increasing concentrations, 62.5 nM (first arrow from the left), 250 nM (second arrow), and 1000 nM (third arrow). The regeneration was achieved with a 2-min pulse of a mixture of 40% formamide, 3.6 M urea, and 30 mM EDTA prepared in milli-Q water. The gray curves represent the experimental data (two overlaid sensorgrams). The black line represents the fit of one sensorgram to a Langmuir 1:1 model according to Equations (1) and (2) reported in the Supplemental Material. (A) SL2 wild type (SL2WT) and the mutated SL2 stem–loop (SL2aca) in which the central UGU sequence of the loop was replaced by ACA. (B) SL2kistem.




