


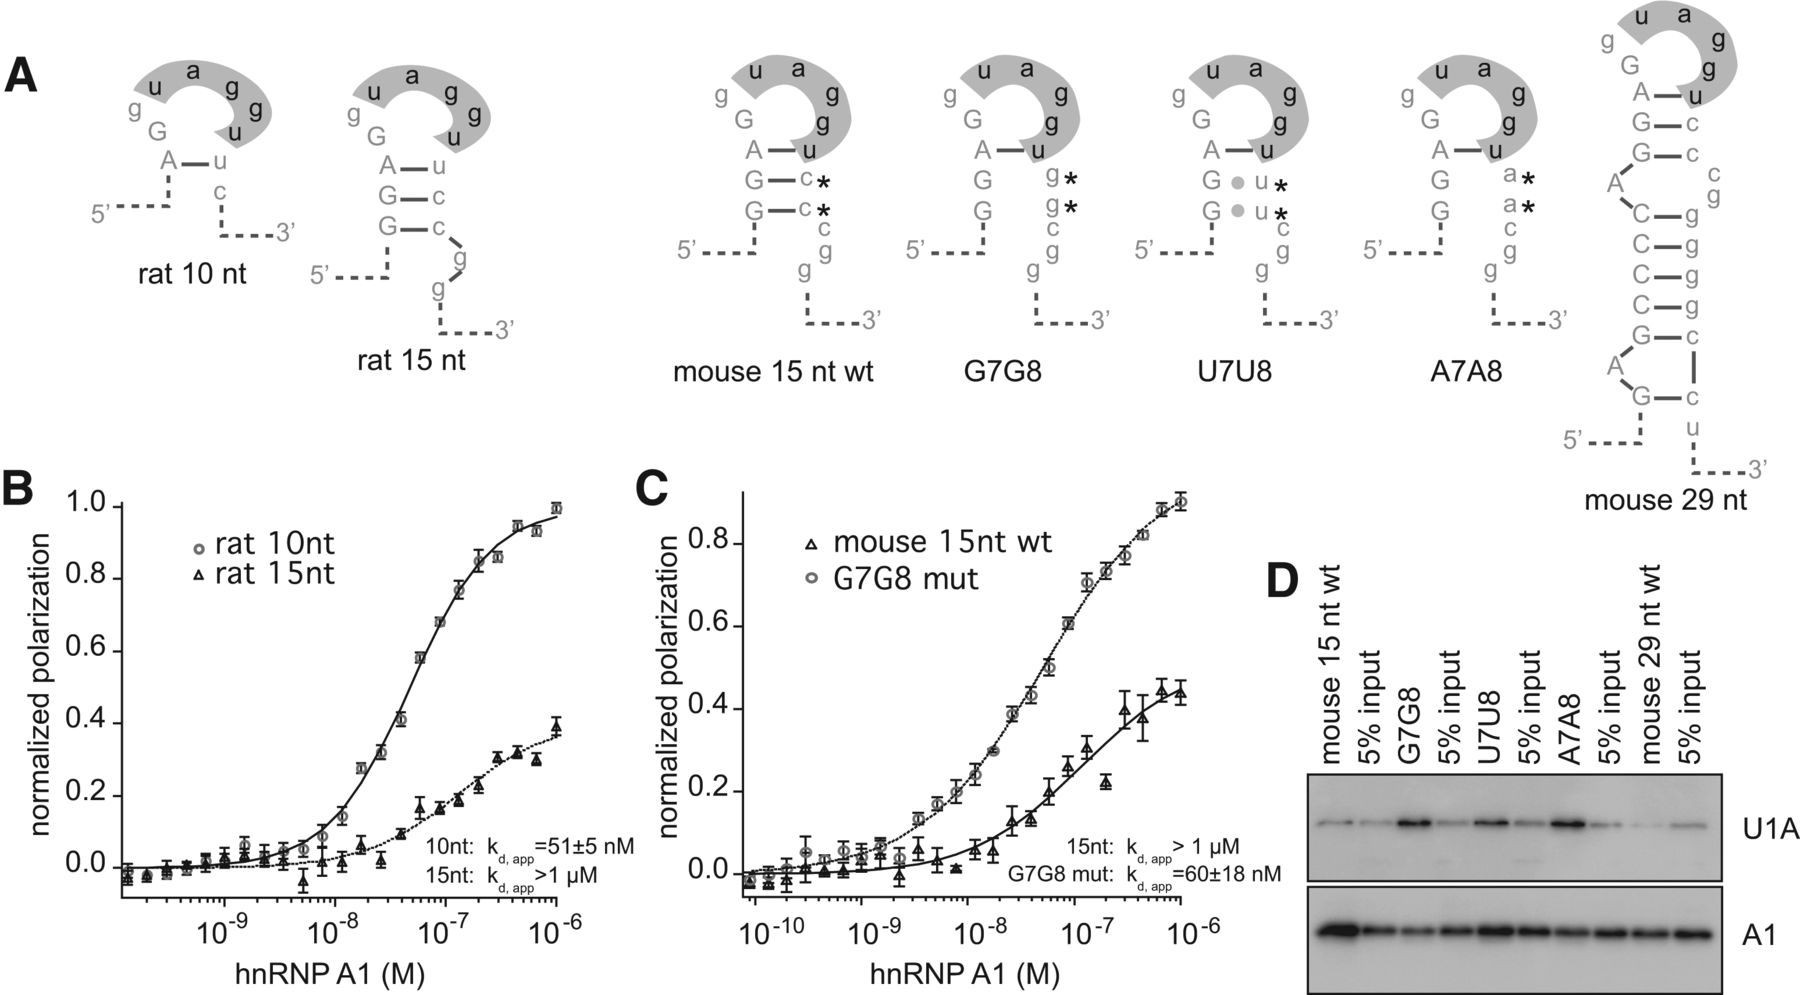
Mag secondary structure modulates association of hnRNP A1 and U1A. (A) Diagram of RNAs used in binding assays. Predicted folding patterns and names used in the text are shown. (B) Fluorescence polarization assay. (Circles) 10-nt rat wild-type RNA; (triangles) 15-nt rat wild-type RNAs. Binding curves were fit to the Hill equation. The fit is shown as a solid line. Error bars indicate the standard deviation of five reads of the microtiter plate. The data were normalized to the maximum and minimum of the fit 10-nt RNA for display purposes. (C) Fluorescence polarization assay. (Triangles) Mouse 15-nt wild-type RNA; (circles) G7G8 RNA. Data were normalized to the maximum and minimum of the fit of the G7G8 RNA for display purposes. (D) Streptavidin pull-down assay. RNAs are as indicated in A. Biotinylated RNAs of the indicated sequence were incubated with a HeLa nuclear lysate, and bound proteins were analyzed by Western blotting. After blotting for U1A, the blot was stripped and reprobed for hnRNP A1.




