


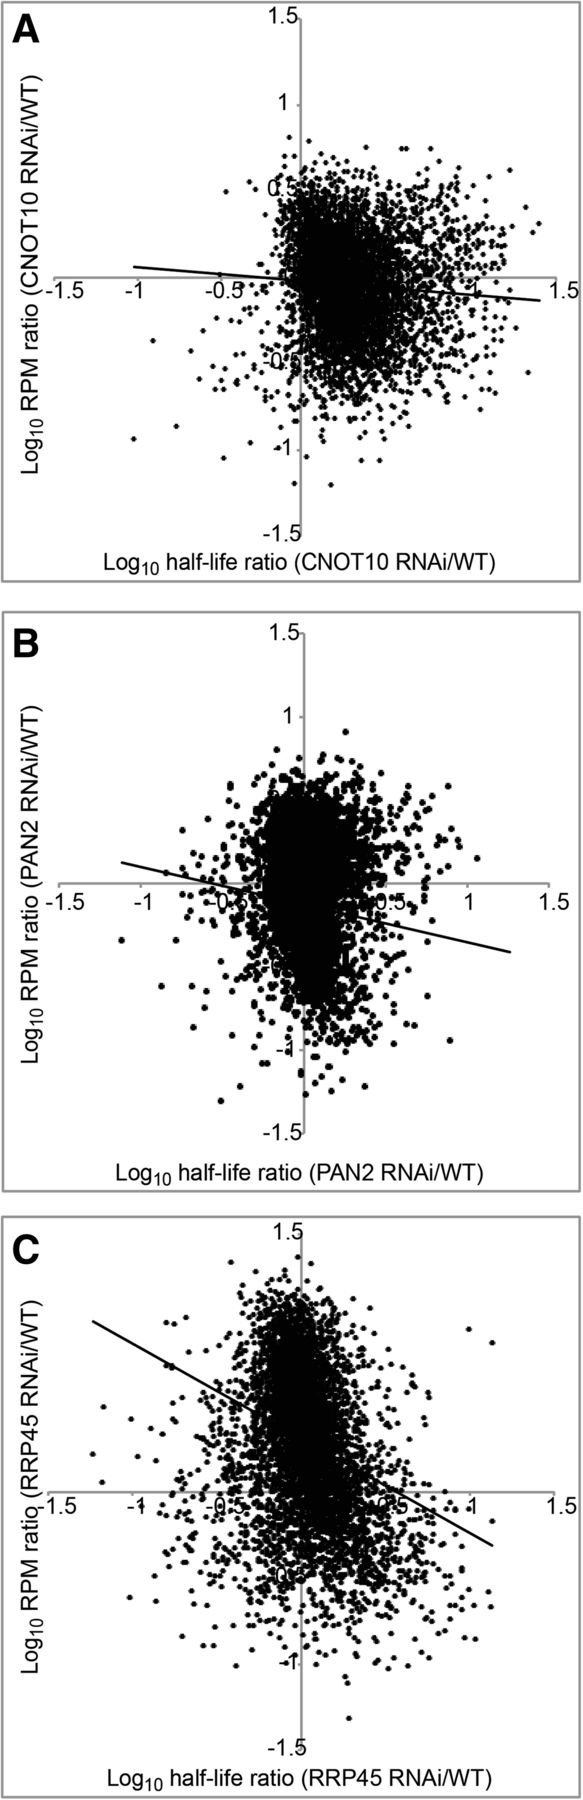
FIGURE 5.
Changes in mRNA half-lives after RNAi do not lead to corresponding changes in mRNA abundance. The mRNA half-life after RNAi (in minutes) was divided by that in wild-type cells and plotted on the x-axis (log10); the mRNA abundance after RNAi (average RPM reads) was divided by that in wild-type cells and plotted on the y-axis (log10). mRNAs with half-lives >240 min were excluded. Trend lines were plotted in Excel. (A) CNOT10 RNAi; (B) PAN2 RNAi; (C) RRP45 RNAi.




