


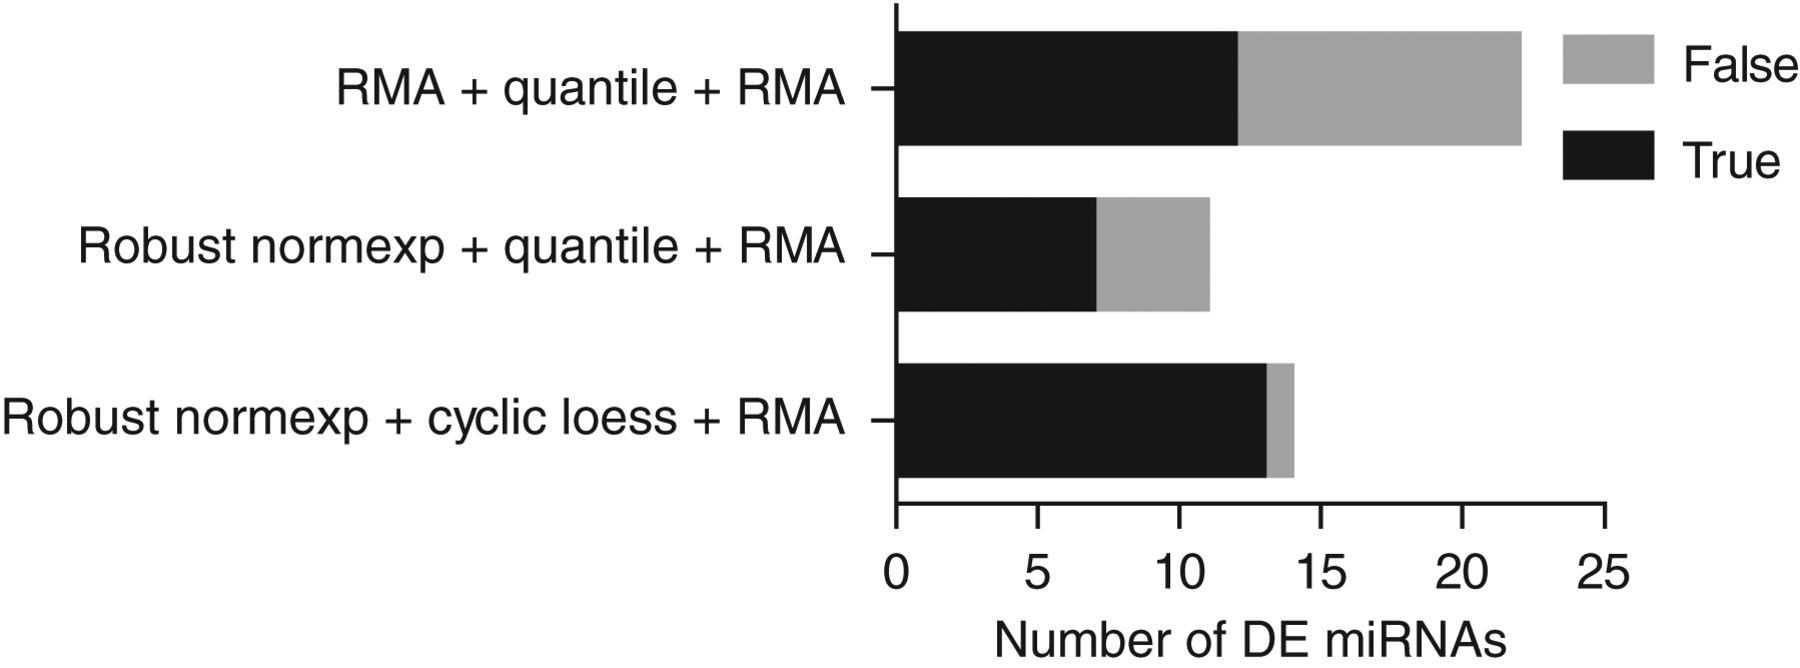
Comparison of different miRNA array normalization strategies and their consistency between miRNA arrays and RNA-seq in prostate cancer samples. Stacked bar graph showing the number of DE miRNAs in normal vs. prostate cancer miRNA microarrays (n = 20), with each normalization technique applied (see Supplemental Table 2 for details) at FDR cutoff of 0.1 with array weights. The analyses shown are restricted to 206 miRNAs detected by independent RNA-seq analyses of normal vs. prostate cancer samples. “True” DE miRNA refers to miRNAs that were DE in the same direction in the miRNA microarray and RNA-seq data. “False” DE miRNAs refer to miRNAs that were not validated to be up- or down-regulated in the RNA-seq analyses (see Supplemental Table 2). The precision (also called positive predictive value) of DE miRNA detection is shown as the ratio of the number of the “true” DE miRNAs to the number of the combined “true” and “false” DE (i.e., the black bar relative to the sum of black and gray bars).




