


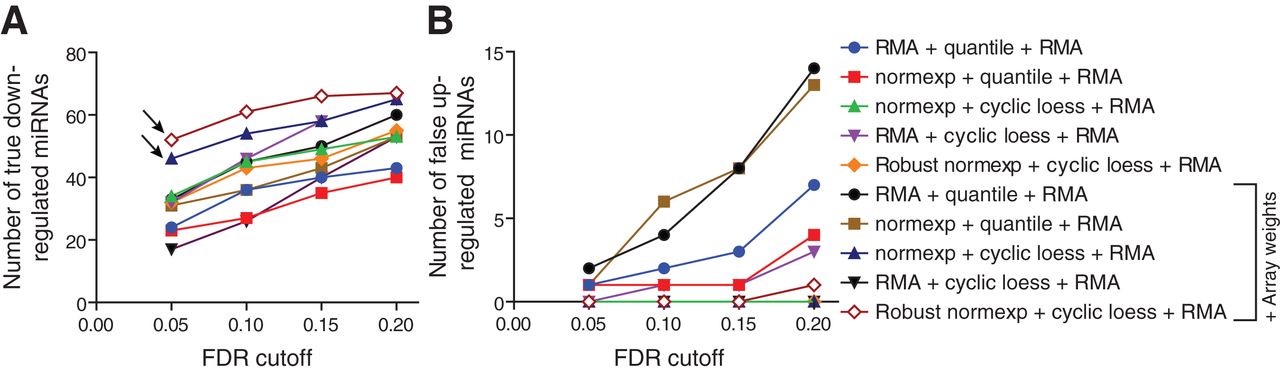
Assessment of true down-regulated and false up-regulated miRNAs in Dicer1-deficient samples. Curves showing the number of differentially expressed miRNAs detected by the miRNA microarrays between days 2 and 4, at various FDR cutoffs, for each normalization technique applied (see Table 3). The analyses shown are restricted to 209 miRNAs that were validated as true down-regulated miRNAs by TaqMan RT-qPCR arrays, also present on the Affymetrix platform (see Materials and Methods). The number of miRNAs confirmed to be significantly “true down-regulated” (A) and significantly “false up-regulated” (B), using the qPCR data as a reference, are given. The arrows highlight the better performance of normexp + cyclic loess + RMA and robust normexp + cyclic loess + RMA with array weights, which gives the highest amount of true down-regulated miRNAs at the most stringent FDR cutoffs of 0.05 and 0.1 (A), while giving a minimum of false up-regulated miRNAs (B).




