


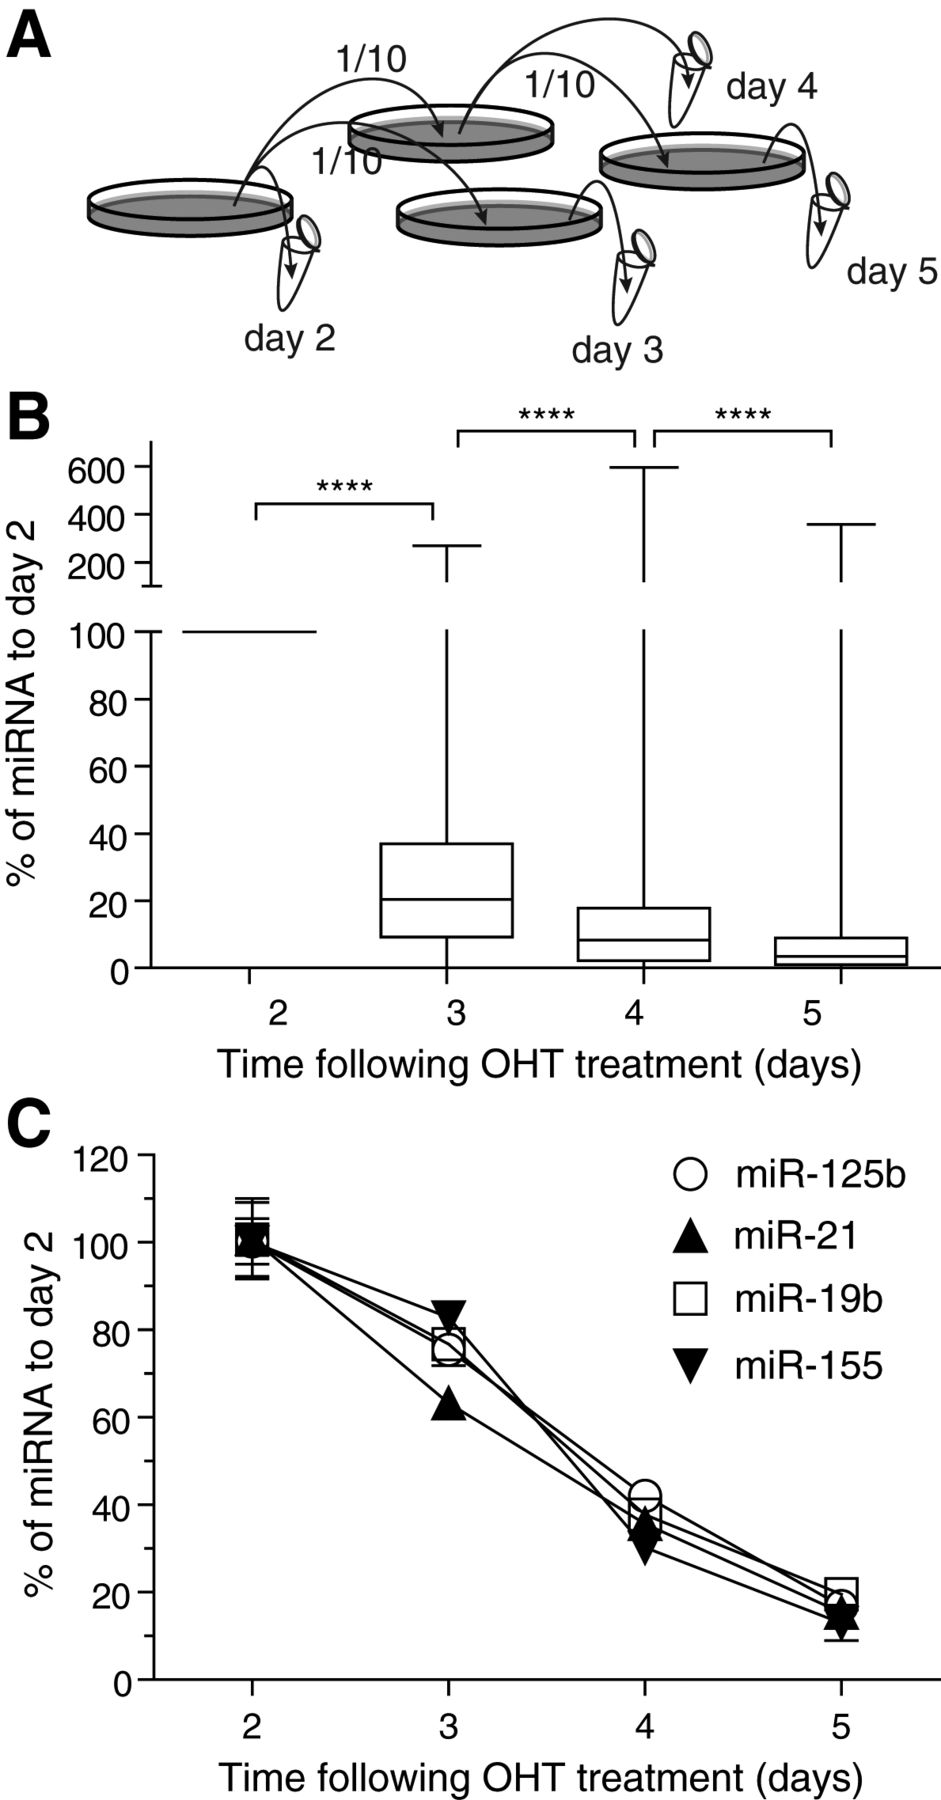
Gradual depletion of miRNAs following OHT treatment of the cells. (A) Schematic representation of the experimental setup. Dicerflox/flox × Cre/Esr1 MEFs were plated in 100-mm dishes, treated overnight with 500 nM OHT, and washed with fresh complete DMEM the next day (day 1). The cells were passaged with 1/10 splits on days 2 and 4 as depicted in the schematic. Cells were lysed, and total RNA was collected from each biological replicate set on days 2, 3, 4, and 5 as indicated. Three biological triplicates were collected for each time point. (B) Box and whiskers plots of 222 miRNAs detected on day 2, from one set of biological samples, by TaqMan low-density RT-qPCR arrays. Whiskers indicate the minimum to maximum values. The amplification data are given in Supplemental Table 1. To compensate for a skewed distribution, the data were log2-transformed prior to statistical analysis. One-tailed paired t-tests comparing the levels of each miRNA at different time points are shown. (****) P < 0.0001 (day 3 vs. day 2: P < 2.2 × 10⁻¹⁶; day 4 vs. day 3: P = 1.74 × 10⁻¹³; day 5 vs. day 4: P = 1.451 × 10⁻⁹). (C) Individual miRNA RT-qPCRs carried out on the samples generated in A confirm gradual depletion of select miRNAs. The results from biological triplicates normalized to the expression of snoRNA202 were reported to the average values for day 2. Error bars show the standard error of the mean (SEM).




