


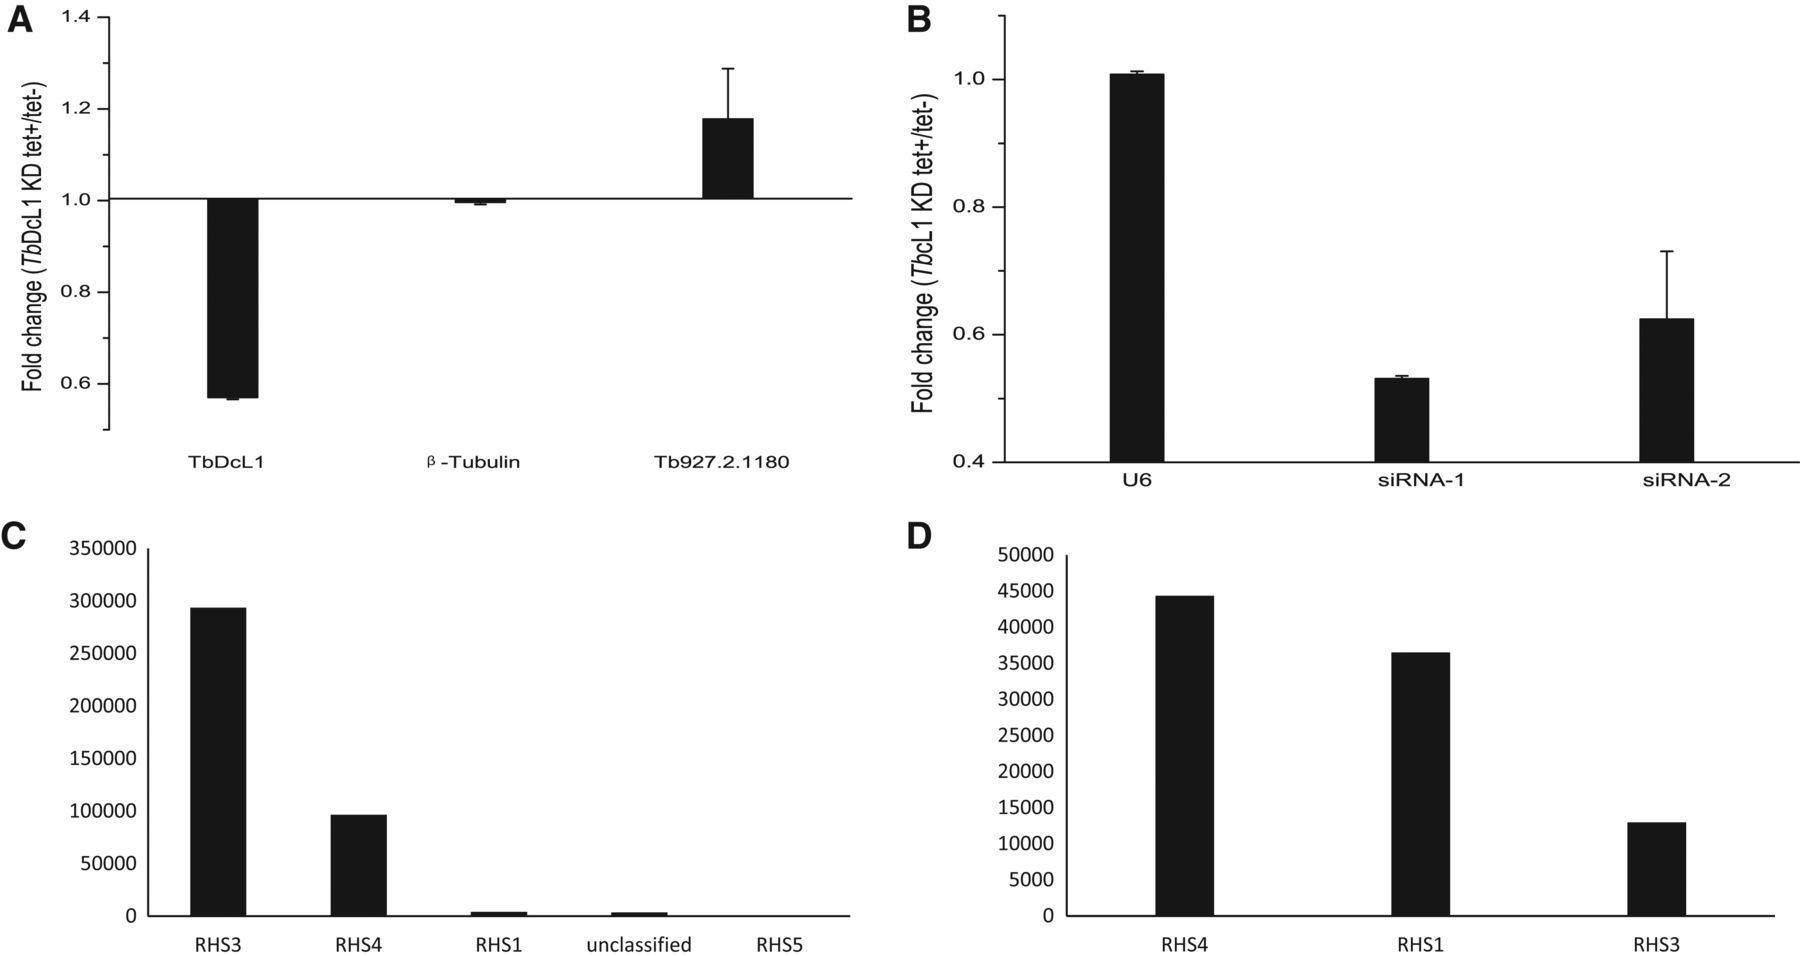
Quantitative RT-PCR analysis of RNA levels in TbDCL1 knockdown cell lines. (A) mRNA level changes in conditional TbDCL1 knockdown cell lines (tet+) compared to noninduced cells (tet−). Housekeeping β-tubulin genes were used as an external control. Error bars (s.d.) are shown (n = 3). (B) Fold-change of selective NAT-siRNAs in conditional TbDCL1 knockdown cell lines (tet+) compared to noninduced cells (tet−); U6 small RNAs added to both induced and noninduced cell lines serve as an external control. Error bars (s.d.) are shown (n = 3). The sequences of siRNAs are listed in Supplemental Table S7. (C,D) Quantity of siRNA which targeted to the genes of the RHS family in SF (C) and PF (D).




