


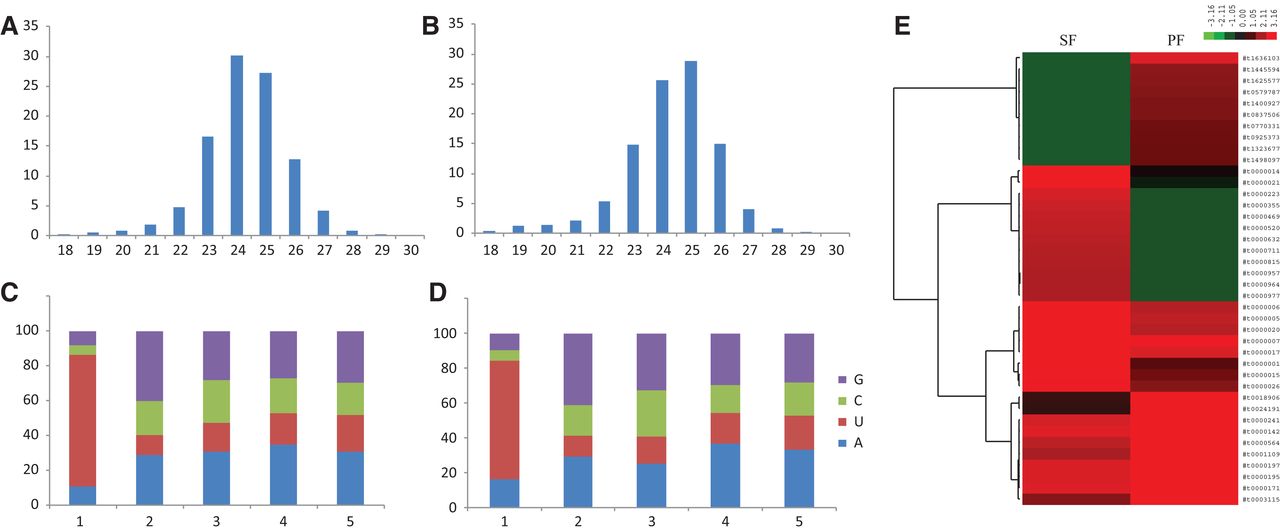
FIGURE 4.
Features of all predicted siRNAs in the two life stages. (A,B) Length distribution of predicted siRNAs in SF (A) and PF (B). (C,D) 5′ end nucleotide of siRNAs in SF (C) and PF (D). (E) The 10 small RNAs expressed the most and the 10 small RNAs expressed the least in the two stages. A normalized method was used according to the following formula: normalized reads abundance = log10(C/N × 106), where C represents the number of siRNA reads and N represents the total number of mapped reads in the library.




