


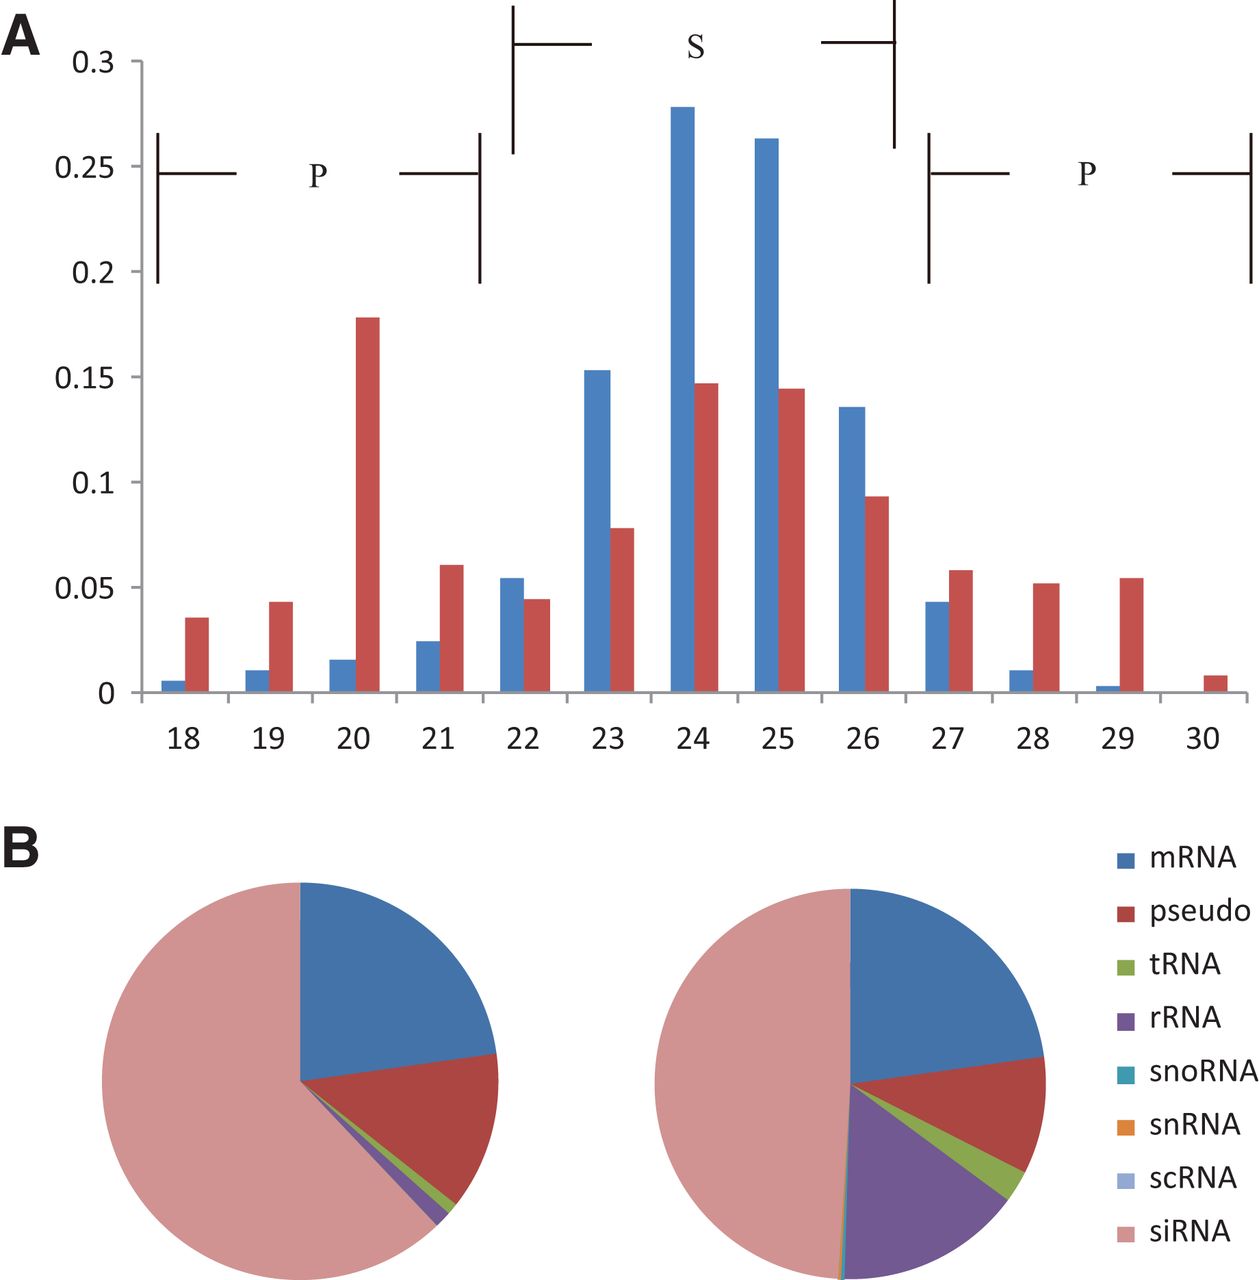
FIGURE 1.
Length and sources of total small RNA sequences in two stages. (A) The length distribution of total small RNAs in two stages. Blue bars represent the SF stage and red bars represent the PF stage. Region S lines show the size of small RNAs expressed more in the SF stage; P is for the PF stage. (B) The sources of small RNAs in two stages; left is the SF stage and right is the PF stage.




