


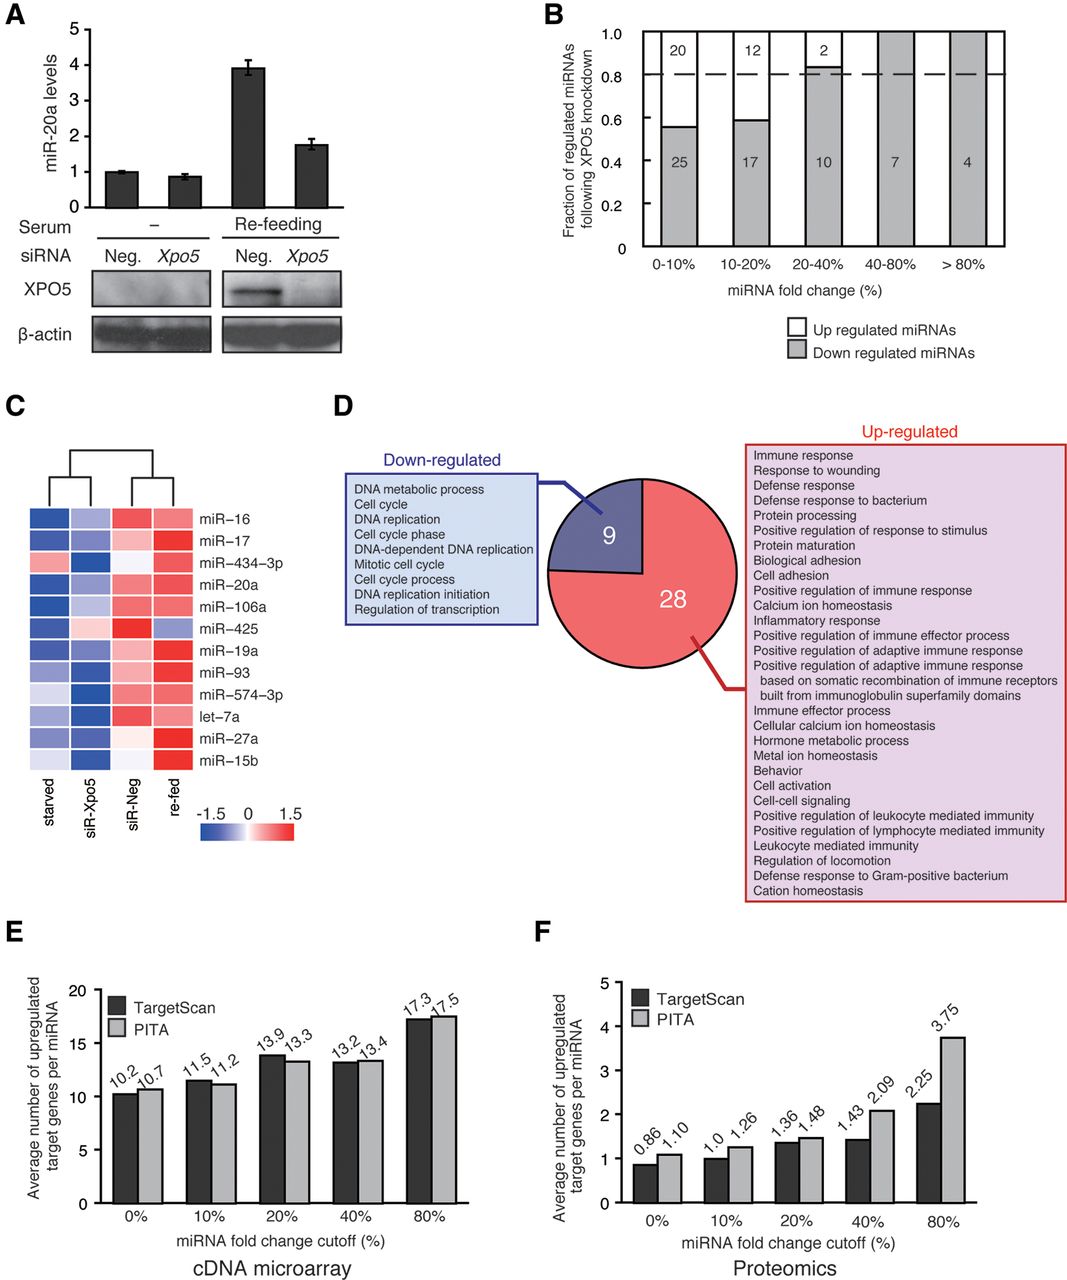
Systems-wide effects of global miRNA elevation. (A) The RNA level of miR-20a in MEF cells (n = 3 mean ± SD) following transfection of Xpo5 or a negative control siRNA into serum-starved or refed cells. Western blotting shows the efficiency of the siRNA transfection; β-actin serves as a loading control. (B) The fractions of miRNAs with different fold changes were shown for XPO5 knockdown (KD) MEF cell samples as described in Figure 1A. (C) Clustering analysis of miRNA expression with fold change >20% in XPO5 KD, with serum refed and their control samples as detailed in the Supplementary Materials and Methods. (D) The fractions of GO terms with different P-value thresholds were shown for genes up-regulated (red) or down-regulated (blue) over 1.5-fold, according to microarray data. (E) Average number of up-regulated miRNA target transcripts predicted by TargetScan or PITA software is shown for each fraction of miRNAs for each different fold change cutoff following the XPO5 KD. The data are from the cDNA microarray. (F) Average number of up-regulated miRNA target proteins from proteomics analysis.




