


FIGURE 1.
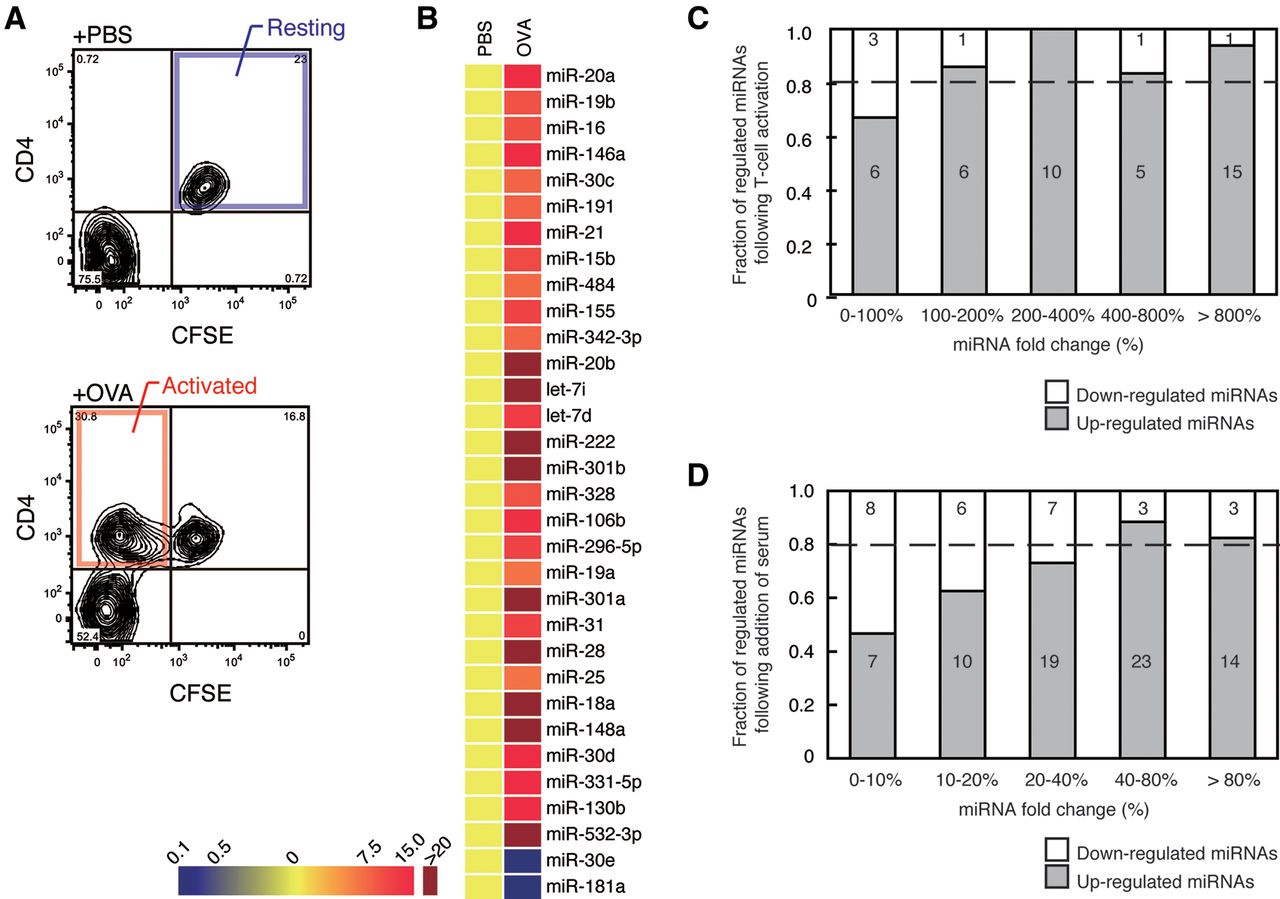
Global miRNA elevation during cell cycle entry. (A) FACS pattern of the resting and activated helper T cells purified using CFSE and CD4 as detailed in the Supplementary Materials and Methods. (B) Heat map of miRNAs with a greater than threefold change in activated T cells (OVA) compared with resting T cells (PBS) is shown. The data are from the real-time PCR array. (C) The fractions of up-regulated (shaded) and down-regulated (open) genes were shown for each range of fold change. miRNAs were binned according to the fold change. (D) The fractions of miRNAs with different fold change for serum-starved and refed MEF cells. Figure shown as described in C.




