


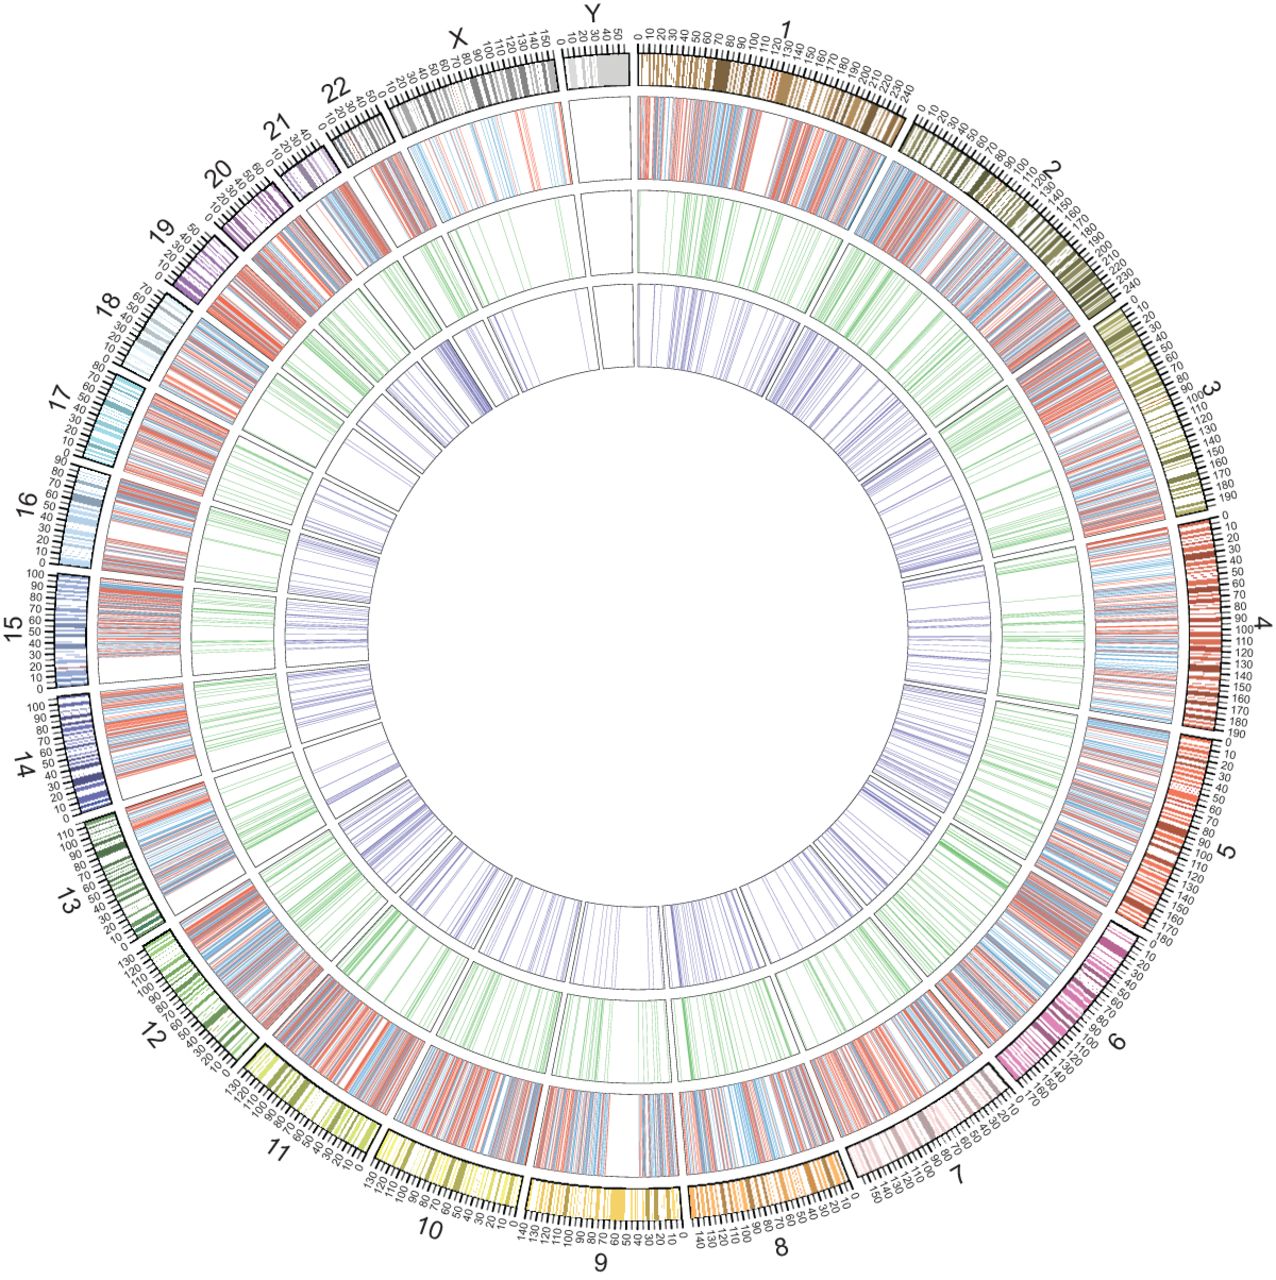
Distribution of reported trait/disease-associated SNPs on human chromosomes. From outside to inside, the first circle represents the human chromosomes. The 6522 previously reported trait/disease-associated SNPs are distributed on the second circle (one line for one SNP); 3481 of these SNPs were previously reported within RefSeq intragenic regions (red lines), while the other 3041 were reported in intergenic regions of RefSeq (blue lines). Among these 3041 trait/disease-associated SNPs, 879 could be remapped within 676 AceView genes (green lines in the third circle), and 724 could be relocated in 532 Ensembl genes (purple lines in the fourth circle).




