


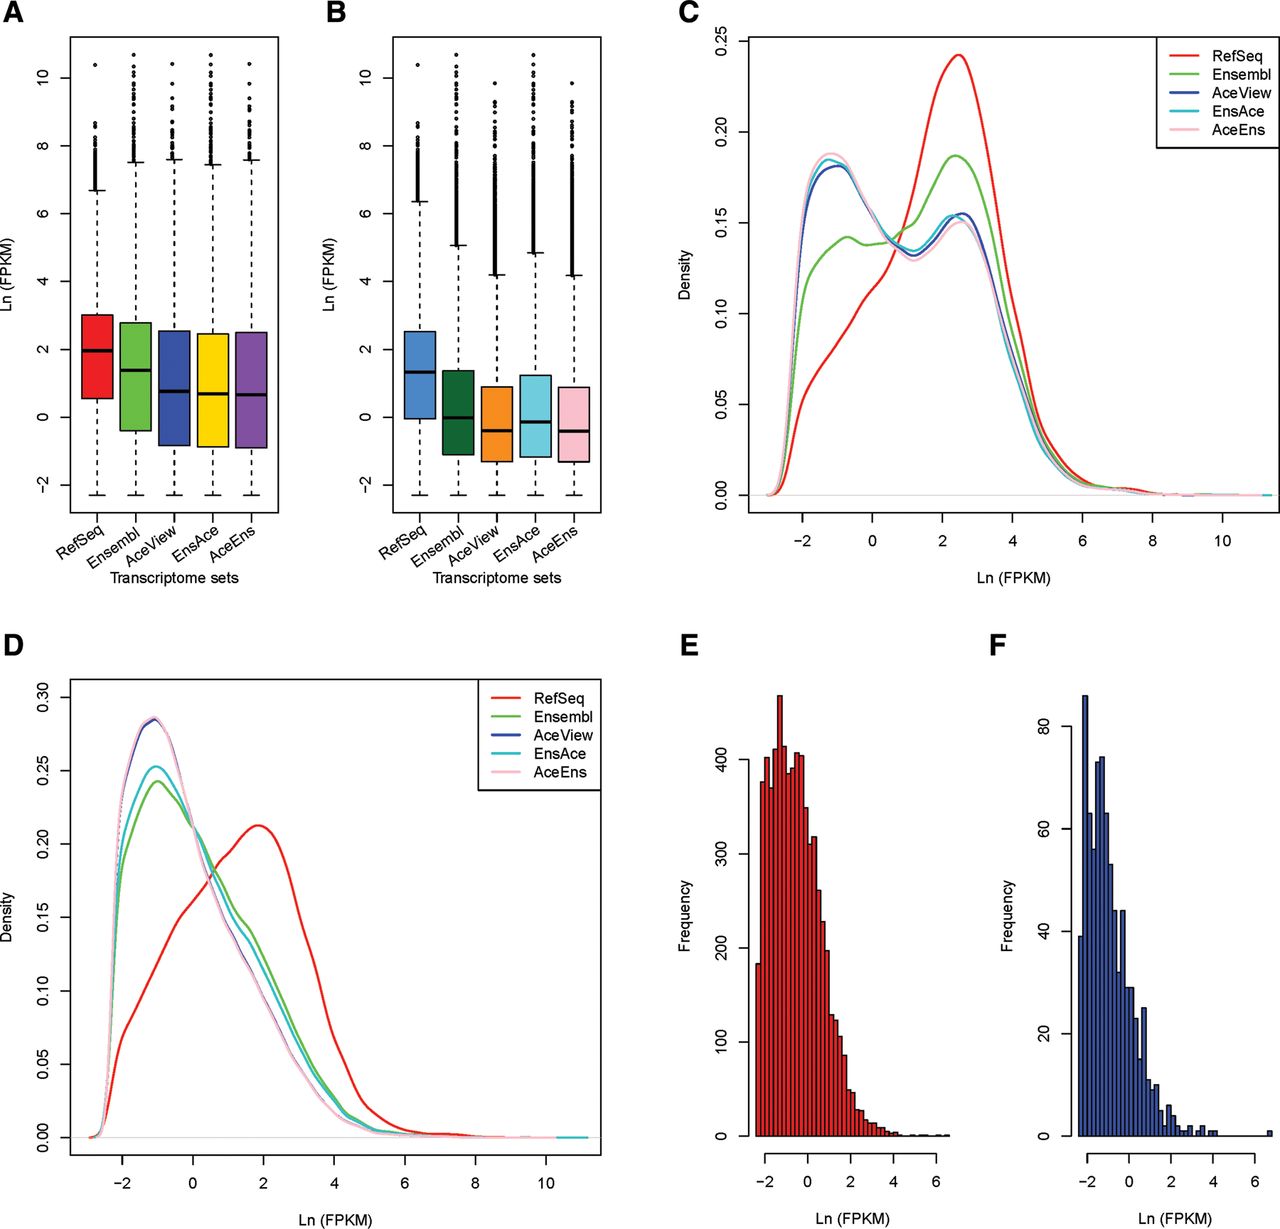
FIGURE 3.
Expression distribution of genes and transcripts in the five transcriptomes. (A) Boxplot comparison of gene expression in our sequenced testis tissue for each transcriptome. (B) Boxplot comparison of transcript expression in testis for each transcriptome. (C) Density curves of gene expression level in testis among five transcriptomes. (D) Density curves of transcript expression level in testis. (E) Expression-level histogram of the AceView genes located in the intergenic and intronic regions of Ensembl annotation in testis. (F) Expression-level histogram of Ensembl genes located in the intergenic and intronic regions of AceView human annotation in testis.




